The Compounding Math Every Stock Picker Should Know
Compounding is the only force in investing that turns ordinary savings into serious wealth, and most investors still underestimate it. The reason is that human intuition runs on addition while compound interest runs on multiplication.
This article puts the actual numbers on the table: doubling times, 30-year outcomes, the cost of small return gaps, and the asymmetry of losses. Every figure below is a straight calculation you can reproduce with the SEC’s compound interest calculator on investor.gov.
The rule of 72
The fastest compounding tool requires no calculator. Divide 72 by your annual return and you get the approximate number of years for money to double.
| Annual return | Approximate doubling time |
|---|---|
| 6% | 12 years |
| 8% | 9 years |
| 10% | 7.2 years |
| 12% | 6 years |
The approximation is tight: $1 at 8% for 9 years grows to $1.999. The rule makes long horizons concrete, since at 8% a 30-year investor gets three doublings and change, better than an 8x multiple.
The rule also works in reverse for sanity checks. A stock that claims to have multiplied 16 times in 24 years implies four doublings, or one every 6 years, which the table translates to a 12% compound rate: plausible for an excellent business, suspicious for a mediocre one.
What $10,000 becomes
Now the full table. Take a hypothetical $10,000, apply a constant annual return, and let it run untouched.
| Annual return | 10 years | 20 years | 30 years |
|---|---|---|---|
| 6% | $17,908 | $32,071 | $57,435 |
| 8% | $21,589 | $46,610 | $100,627 |
| 10% | $25,937 | $67,275 | $174,494 |
| 12% | $31,058 | $96,463 | $299,599 |
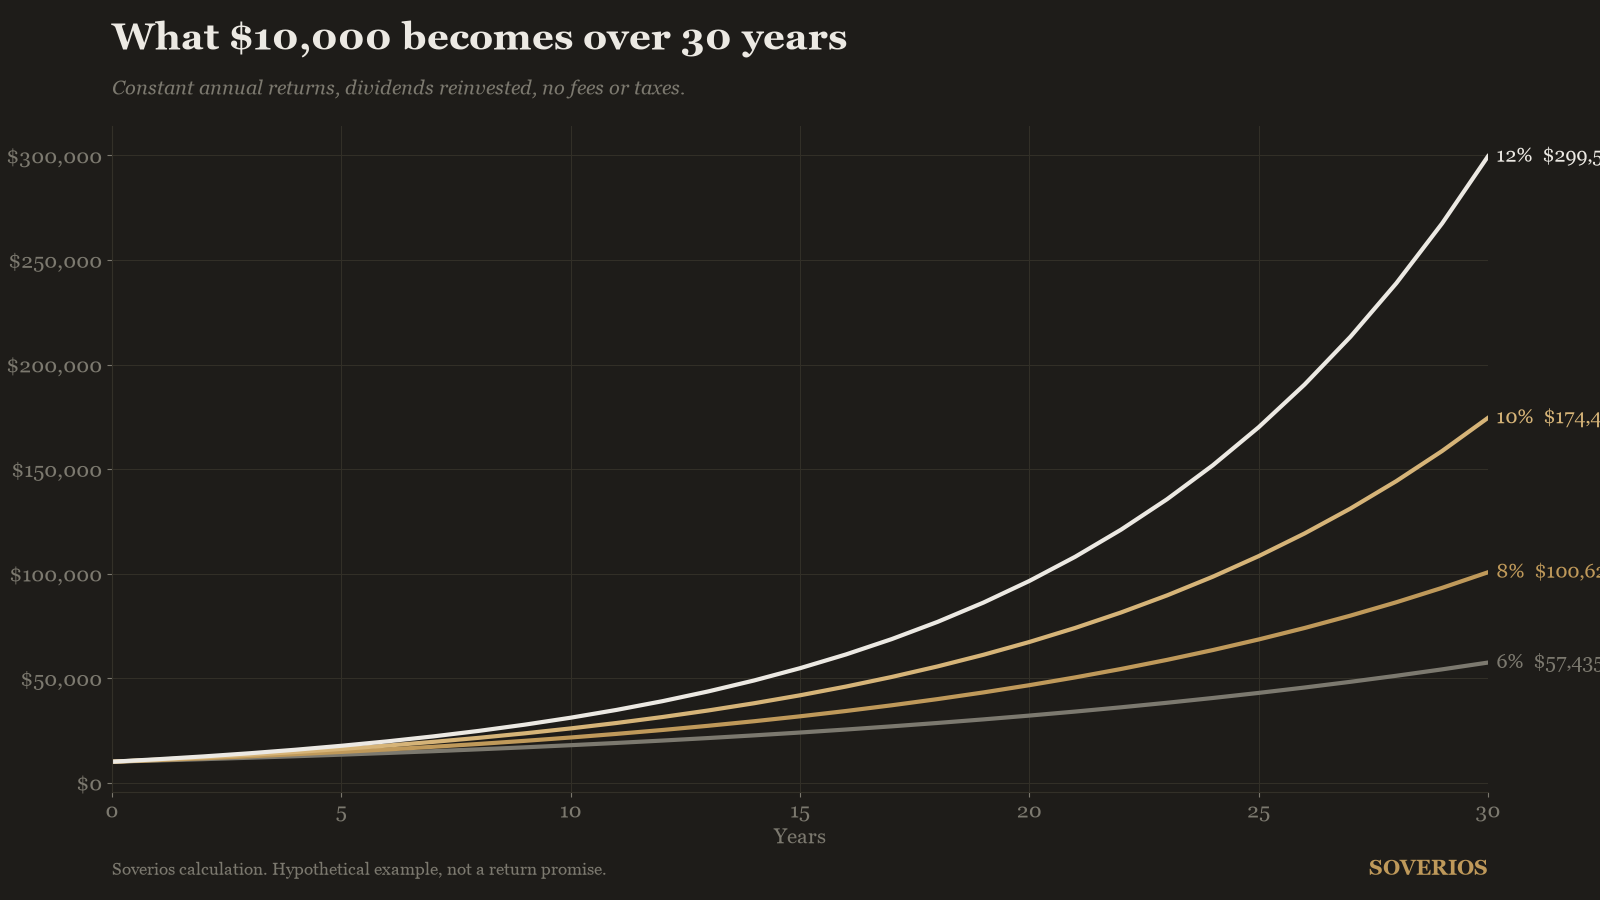
Read the 8% row from left to right. The first decade adds $11,589, the second adds $25,021, and the third adds $54,017, more than the first two decades combined.
That back-loading is the defining feature of compounding. It is why an adequate return sustained over a long time horizon beats a spectacular return that only lasts a few years, and why interrupting the process mid-curve is so expensive.
Monthly contributions: compounding a paycheck
The single-deposit table understates what most investors actually do, which is add money every month. Fresh contributions stack on top of the multiplication, and the combination is powerful.
Suppose $500 invested at the end of each month for 30 years, with returns compounded monthly. Total contributions come to $180,000, and the market does the rest.
| Annual return | $180,000 contributed becomes |
|---|---|
| 6% | About $502,000 |
| 8% | About $745,000 |
| 10% | About $1,130,000 |
At 8%, roughly three quarters of the final balance is growth rather than deposits. The back-loading applies here too: the early years look unimpressive, and the final decade does most of the heavy lifting.
Two points of return are worth 73% more money
Look down the 30-year column instead. Moving from 8% to 10% does not add 25% to the outcome, it adds 73%: $174,494 against $100,627.
The same lever works in reverse through costs. One point of annual fees turns 8% into 7%, and $100,627 into $76,123, a 24% haircut on final wealth from a charge that looks harmless in any single year, which is why we dedicate a full article to what expense ratios really cost over 20 years.
This is also the honest frame for active investing. An edge of two points a year sounds modest, but held for 30 years it is the difference between a comfortable outcome and a transformative one.
It cuts the other way with equal force. An investor whose stock picks lag a simple index by two points a year pays the same $73,867 in reverse, which is why the decision to pick stocks deserves the same scrutiny as any stock pick.
The asymmetry of losses
Compounding has a dark side: percentages are not symmetric around zero. A loss must be recovered on a smaller base, so the required gain is always larger than the loss that caused it.
| Drawdown | Gain needed to break even |
|---|---|
| 10% | 11.1% |
| 20% | 25% |
| 33.3% | 50% |
| 50% | 100% |
A deep drawdown does not just cost money, it costs time, because the recovery gain has to be compounded from the bottom. The historical record of how long that takes is laid out in our review of bear markets in history.
For a stock picker the lesson is blunt: avoiding permanent capital loss is not caution, it is return optimization. A portfolio that misses some upside but skips the 50% losers can out-compound a flashier one.
Dividends are compounding in disguise
Reinvested dividends feed the same engine. Compare a hypothetical stock whose price grows 5% a year with the same stock plus a 3% dividend yield reinvested, for a total return of 8%.
| Scenario | $10,000 after 30 years |
|---|---|
| 5% price growth only | $43,219 |
| 5% price growth + 3% yield reinvested | $100,627 |
Reinvestment more than doubles the outcome, because every dividend buys shares that pay their own dividends. That is the mechanism behind a DRIP, and it is why the trade-off between dividend yield and dividend growth is really a compounding question.
Inflation compounds too
The same multiplication runs against you through prices. At 3% inflation, the cost of living multiplies by 2.43 over 30 years, since 1.03 compounded 30 times is 2.43.
So the $100,627 that an 8% return produces over 30 years buys what roughly $41,500 buys today. The nominal tables above are honest arithmetic, but the real, after-inflation figure is the one your future self actually spends.
That reframes the return targets. An investor who needs to double purchasing power in 30 years cannot settle for a return near the inflation rate, because compounding a 1% real edge for 30 years produces only about a 35% real gain.
What this means for a stock picker
The math above sets the job description. First, find businesses that compound internally: a company reinvesting profits at a high return on invested capital grows per-share value without you lifting a finger, which is why we treat ROIC as a quality test.
Second, protect the base. The drawdown table says one blown-up position costs more than several missed opportunities, so the checklist work comes before the buy.
Third, give the curve time. The gap between staying invested and hopping in and out, priced in time in the market vs timing the market, and the deployment question covered in dollar-cost averaging vs lump sum, both reduce to the same rule: interruptions starve the multiplication.
None of this promises a result, and past growth rates guarantee nothing about future ones. But the arithmetic of beating the market is fixed: a small annual edge, protected from large losses and compounded for decades, is the entire game.
Frequently asked questions
How accurate is the rule of 72?
Very accurate in the range most investors care about. Dividing 72 by the annual return approximates the years to double: at 8%, the rule says 9 years and the exact figure is 9.01. It drifts a little at very high rates but stays close enough for portfolio math.
Why does compounding feel slow at first?
Because early gains are earned on a small base. At 8%, a $10,000 portfolio earns about $800 in year one but over $7,400 in year 30, since by then the base has grown tenfold. The curve is back-loaded by nature, which is why the time horizon matters more than the starting amount.
Do small fee differences really matter?
Over long periods, enormously. One point of annual cost turns an 8% return into 7%, which cuts a 30-year outcome from $100,627 to $76,123 on a $10,000 start. That is 24% of final wealth gone to a difference that looks trivial in any single year.
Does compounding work the same way for a single stock?
The portfolio math is identical, but a single business compounds through its own economics: the returns it earns on reinvested capital. A company that reinvests profits at high rates of return does the compounding for you, which is why quality metrics matter to long-term holders.
Educational content only, not investment advice. See our methodology and disclaimer.
Sources: www.investor.gov