Featured · Foundations
Bear Markets in History: How Long They Last, How Deep They Go
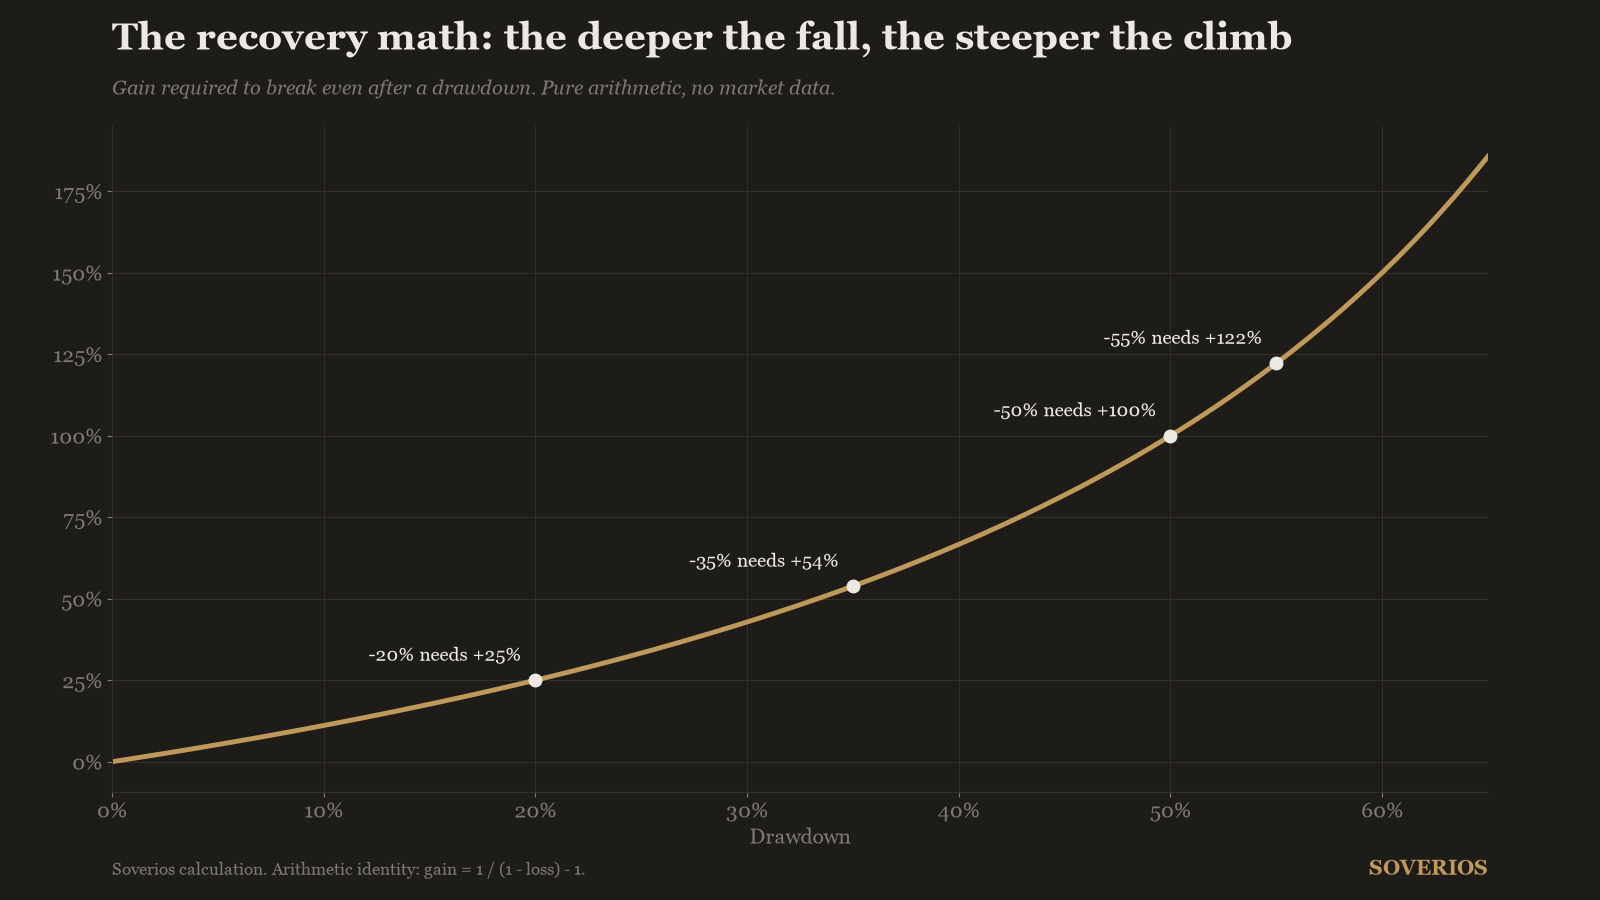
What bear market history shows: how deep the major declines went, how long they lasted, and what the recovery math demands from investors.
Independent investing research
Arcarios is a finance media built on data, part of the Soverios group. We publish the math behind stocks, dividends and market history, and we track our own portfolios against the major indexes, dividends reinvested. No hype, no advice: numbers you can check.
29 data-backed articles · 119 terms explained with real numbers · original data studies
Every number links to where it comes from, or is shown as our own calculation with the method attached.
Articles carry a real author, a publication date and a visible last update. No ghost content.
Universe, extraction date and limitations published with every study. If we screen it, you see how.
What bear market history shows: how deep the major declines went, how long they lasted, and what the recovery math demands from investors.
What Dividend Aristocrats are, what the 25-year rule really filters for, and the math that decides when dividend growth beats high yield.
Tracking difference is the gap between an index fund's return and its index. It often costs more than the expense ratio. Here is how to measure it.
A high yield can signal a dividend about to be cut. Six warning signs, the payout math behind them, and a checklist to run before buying any high yielder.
Stock-based compensation is a real expense that inflates free cash flow and dilutes shareholders. Here is how to measure what it really costs you.
Doubling times, return gaps, and drawdown asymmetry: the compounding arithmetic that decides what a portfolio is worth in 30 years.
A 12-metric checklist with indicative thresholds and where to find each number in the filings, so you can screen any stock in under an hour.
Every term in three moves: The math (a worked example in dollars), The trap (where investors get burned), The move (what a stock picker does with it).
A dividend trap is a stock whose unusually high yield signals a coming dividend cut or business decline rather than a genuine income bargain.
A capitalization-weighted index of about 500 large US companies, where the biggest market values carry the most weight.
The cash a company generates from operations minus capital expenditures. A measure of what a business really earns in cash terms.
A durable competitive advantage that protects a company's profits from competition. The difference between a good year and a good business.
The discount between price paid and estimated value. The buffer that absorbs bad luck and bad analysis alike.
The annual fee a fund or ETF charges, as a percentage of your invested assets. Deducted automatically, compounding against you every year.
Arcarios is a finance media built on data, part of the Soverios group. We run our own screening engine, track our own portfolios against the major indexes with dividends reinvested, and publish the results with the method attached. When a number is ours, we say so and show how it was computed; when it is not, we link the source. We publish analysis, never advice: what you do with the numbers stays your decision. Read how our research is produced and what we will never tell you to do.