Time in the Market vs Timing the Market: The Actual Numbers
Should you wait for a better entry point, or invest now and stay put? The arithmetic gives a clear answer: the expected cost of waiting is higher than the expected value of a clever entry, because timing errors compound for decades.
The popular version of this argument leans on a statistic about missing the market’s 10 best days. That figure is usually quoted without a source, so this article rebuilds the logic from scratch, with calculations you can check line by line.
The problem with the famous statistic
You have probably seen the claim: an investor who missed the 10 best days over some 20-year stretch earned a fraction of the market’s return. The claim is directionally right, but the exact numbers float around the internet unsourced, so we will not repeat them.
Instead, here is the mechanism in a form you can verify yourself. One worked example is enough to show why missing strong days is so expensive.
Suppose a hypothetical index gains 10% in a year, and suppose its two best sessions were each worth +3%. An investor who sat out those two days, and only those two days, ends the year with 1.10 divided by (1.03 x 1.03), which is 1.0369.
| Scenario | Return for the year |
|---|---|
| Fully invested | +10.0% |
| Missed the two best days (+3% each) | +3.7% |
Two absences out of roughly 250 trading days erased nearly two thirds of the year’s gain. That is the whole engine behind every version of the missed-days statistic.
The published versions simply run this arithmetic over 20 years of real data, where the best days are larger and more numerous. The exact figures depend on the window chosen, but the shape of the result never changes: a handful of sessions carries a startling share of the total return.
Why nobody catches the best days
Big daily moves cluster. Calm markets produce small moves in both directions, and panicked markets produce large moves in both directions, which is what volatility means in practice.
The consequence is uncomfortable for timers: the strongest up days tend to sit inside the ugliest stretches, often within days of the worst declines. An investor who sells during a market correction is, almost by construction, in cash when the sharpest rebound days arrive.
To capture those days, a timer would need to re-enter while the news is at its worst and the decline looks unfinished. That is precisely the moment the original exit decision was designed to avoid, so the strategy fights its own psychology.
What a small annual drag costs over 30 years
Timing mistakes rarely show up as one dramatic error. They show up as a small annual drag: out of the market during a rebound here, a late re-entry there.
So price the drag. Suppose a hypothetical market returns 8% a year for 30 years, and compare an investor who captures all of it with investors who lose one or two points a year to timing errors, starting from $10,000.
| Annual return captured | $10,000 after 30 years |
|---|---|
| 8% | $100,627 |
| 7% | $76,123 |
| 6% | $57,435 |
Two points of drag removes $43,192, more than four times the original stake. The gap keeps widening every year because compound interest works on a smaller base at every step, a dynamic covered in detail in our guide to the compounding math behind long-term returns.
The price of waiting for the dip
There is a quieter form of timing: keeping money in cash while waiting for a pullback to provide a better entry. That wait has a price too, and it compounds the same way.
Suppose the same 8% market, and a saver who parks $10,000 in cash earning 3% while waiting. Here is what the same 30-year window delivers depending on how long the wait lasts.
| Strategy over the same 30 years | Ending value |
|---|---|
| Invest now, 30 years at 8% | $100,627 |
| Wait 1 year in cash at 3% | $95,968 |
| Wait 3 years in cash at 3% | $87,288 |
| Wait 5 years in cash at 3% | $79,393 |
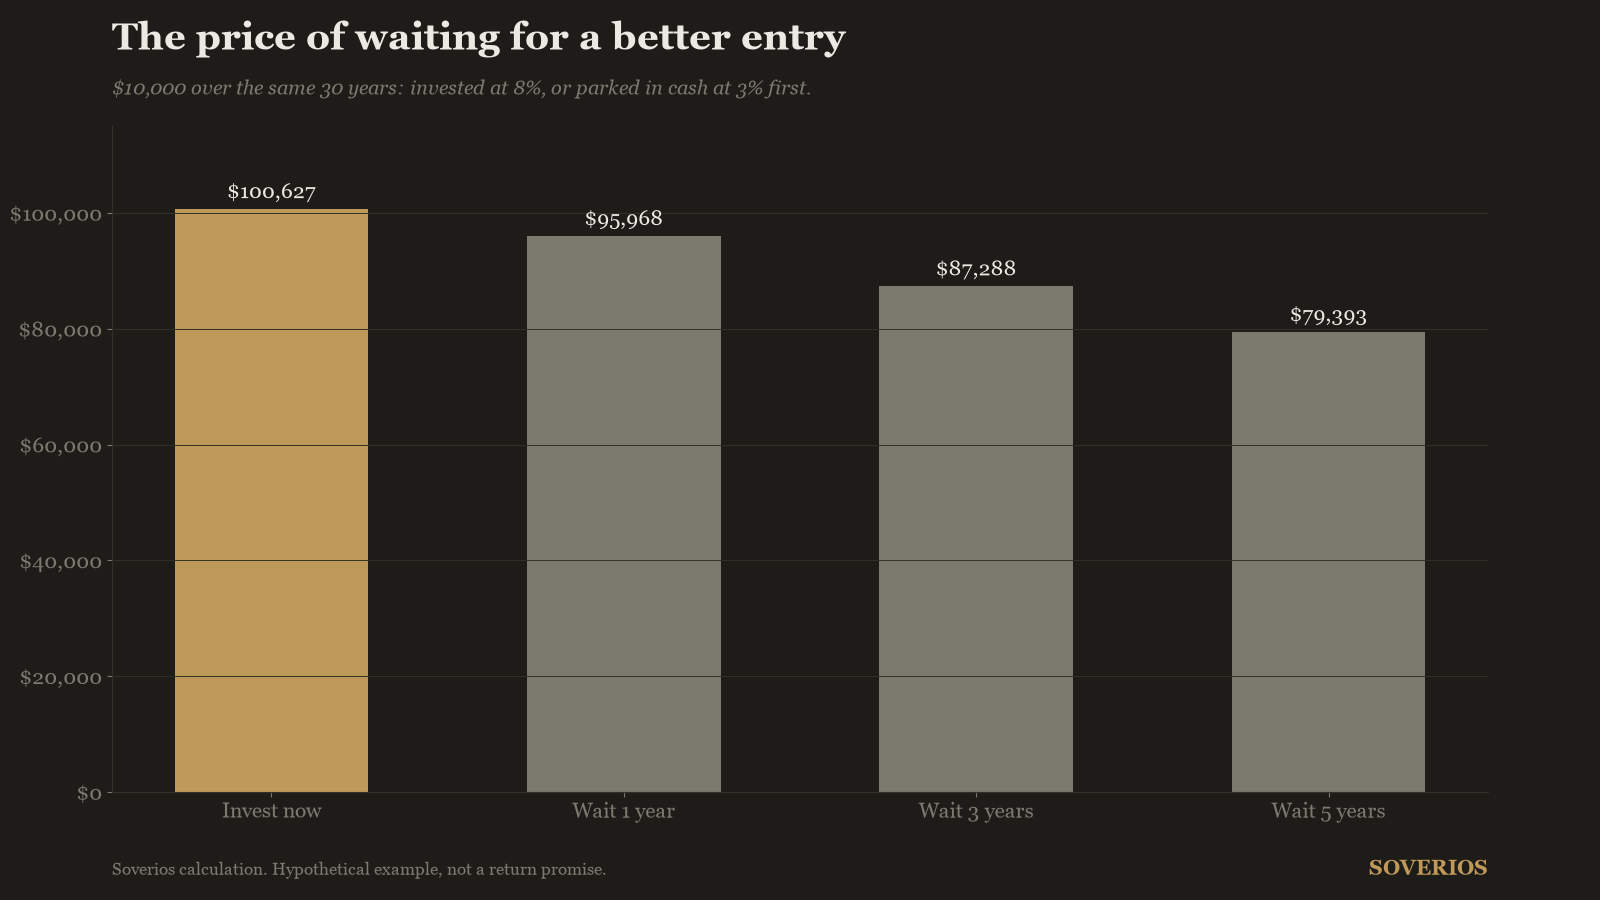
A five-year wait costs $21,234 even though the cash earned interest the whole time. For the wait to break even, the market five years from now would have to sit more than 21% below the path an 8% return would have traced.
Dips of that size do happen, but they cannot be scheduled. The waiting saver is betting a known, growing cost against an unknown date.
Timing means being right twice
A market timer does not make one decision. Every round trip requires a correct exit and a correct re-entry, and the two multiply.
Grant a timer 60% accuracy on each call, which is generous. The probability that both calls in a round trip are right is 0.6 x 0.6, or 36%.
| Accuracy per call | Odds both calls are right |
|---|---|
| 50% | 25% |
| 60% | 36% |
| 70% | 49% |
Even at 70% per call, a full round trip is a coin flip. And every losing round trip adds to the annual drag priced in the table above.
For US taxpayers there is a second cost: selling winners in a taxable account can trigger capital gains tax, and positions held a year or less are taxed at ordinary income rates. The timer pays for the attempt whether or not it works.
Whipsaws add a third cost. A timer shaken out during a correction that reverses quickly ends up buying back at higher prices, locking in a loss no buy-and-hold investor ever experienced.
What staying invested really requires
Honesty matters here: time in the market is not a free lunch. Staying fully invested means absorbing every drawdown, and the recovery math is brutal, since a 50% decline requires a 100% gain just to break even.
History says those declines are a recurring feature, not an anomaly, as our review of bear markets in history shows. The strategy only works across a long time horizon, which means money you might need during a decline does not belong in stocks in the first place.
The stock picker’s alternative to timing
None of this means acting blindly. It means redirecting effort from an unwinnable question, where the market goes next, to a winnable one, which businesses are worth owning at what price.
Buying on a fixed schedule removes the entry decision entirely. That approach, dollar-cost averaging, has its own trade-offs against investing everything at once, and we run the actual numbers on both separately.
Price discipline still applies, and it is not timing. Passing on a specific stock because it trades far above your estimate of value is a judgment about one business, not a forecast about the market.
That is the premise behind beating the market: the edge comes from selection, not from calendar calls. Automate your buying, reserve cash only for opportunities you have already researched, and judge every decision over your full holding period rather than over the next quarter.
Frequently asked questions
Does time in the market always beat timing the market?
Not in every stretch. An investor who sold before a major crash and bought back near the bottom did better. The problem is that both calls must be right, the odds compound against you, and the cost of being wrong grows for decades.
What does missing the best days actually do to returns?
Strong single days are a large share of any year's gain. In a hypothetical year that returns 10%, two days of +3% account for most of it: miss both and the year returns 3.7%. Repeat that a few times over 30 years and the compounded gap becomes enormous.
Is dollar-cost averaging a form of market timing?
No. Dollar-cost averaging invests on a fixed schedule regardless of prices, which is the opposite of timing. It removes the entry decision entirely instead of trying to optimize it.
Is selling an overvalued stock market timing?
No. Selling one business because its price has run far past your estimate of value is a judgment about that business. Market timing is a forecast about the whole market's direction, which is a much harder claim to get right.
Educational content only, not investment advice. See our methodology and disclaimer.
Sources: www.investor.gov