ROIC vs ROE: Which One Measures Quality?
Return on equity is the most quoted profitability ratio in investing, and it is also the easiest to manipulate. Return on invested capital is quoted far less, and it is the one that actually measures quality.
The difference between them is a single word: debt. Understanding what each ratio does with borrowed money tells you which companies earn their returns and which ones rent them.
What ROE measures
ROE answers the shareholder’s question: what did the company earn on my capital this year?
ROE = net income / shareholders’ equity
Take a hypothetical company with net income of $100 million and shareholders’ equity of $500 million. Its return on equity is 20 percent, a figure most investors would read as excellent.
The problem is what the formula ignores. Equity is only one source of capital, and nothing in the ratio reveals how much debt worked alongside it to produce that $100 million.
What ROIC measures
ROIC asks a stricter question: what did the company earn on all the capital tied up in the business, no matter who supplied it?
ROIC = after-tax operating profit / (shareholders’ equity + total debt)
The numerator is operating profit with taxes removed, often called NOPAT. It uses operating profit because the denominator includes lenders’ money, so the profit measure must be the one generated before interest payments split the proceeds.
Suppose a hypothetical company produces $160 million of operating profit and pays a 25 percent tax rate, leaving $120 million of NOPAT. With $500 million of equity and $500 million of debt, its invested capital is $1 billion and its ROIC is 12 percent.
Notice what happened: a company that might report a 20 percent ROE earns 12 percent on its true capital base. The gap between the two numbers is the work debt is doing.
How leverage flatters ROE
The distortion becomes obvious when two businesses with identical earnings carry different balance sheets. Assume a 20 percent tax rate for both hypothetical companies.
Company A has no debt. It earns $125 million of operating profit, pays $25 million in tax, and keeps $100 million on $500 million of equity: ROE 20 percent, and since invested capital equals equity, ROIC is also 20 percent.
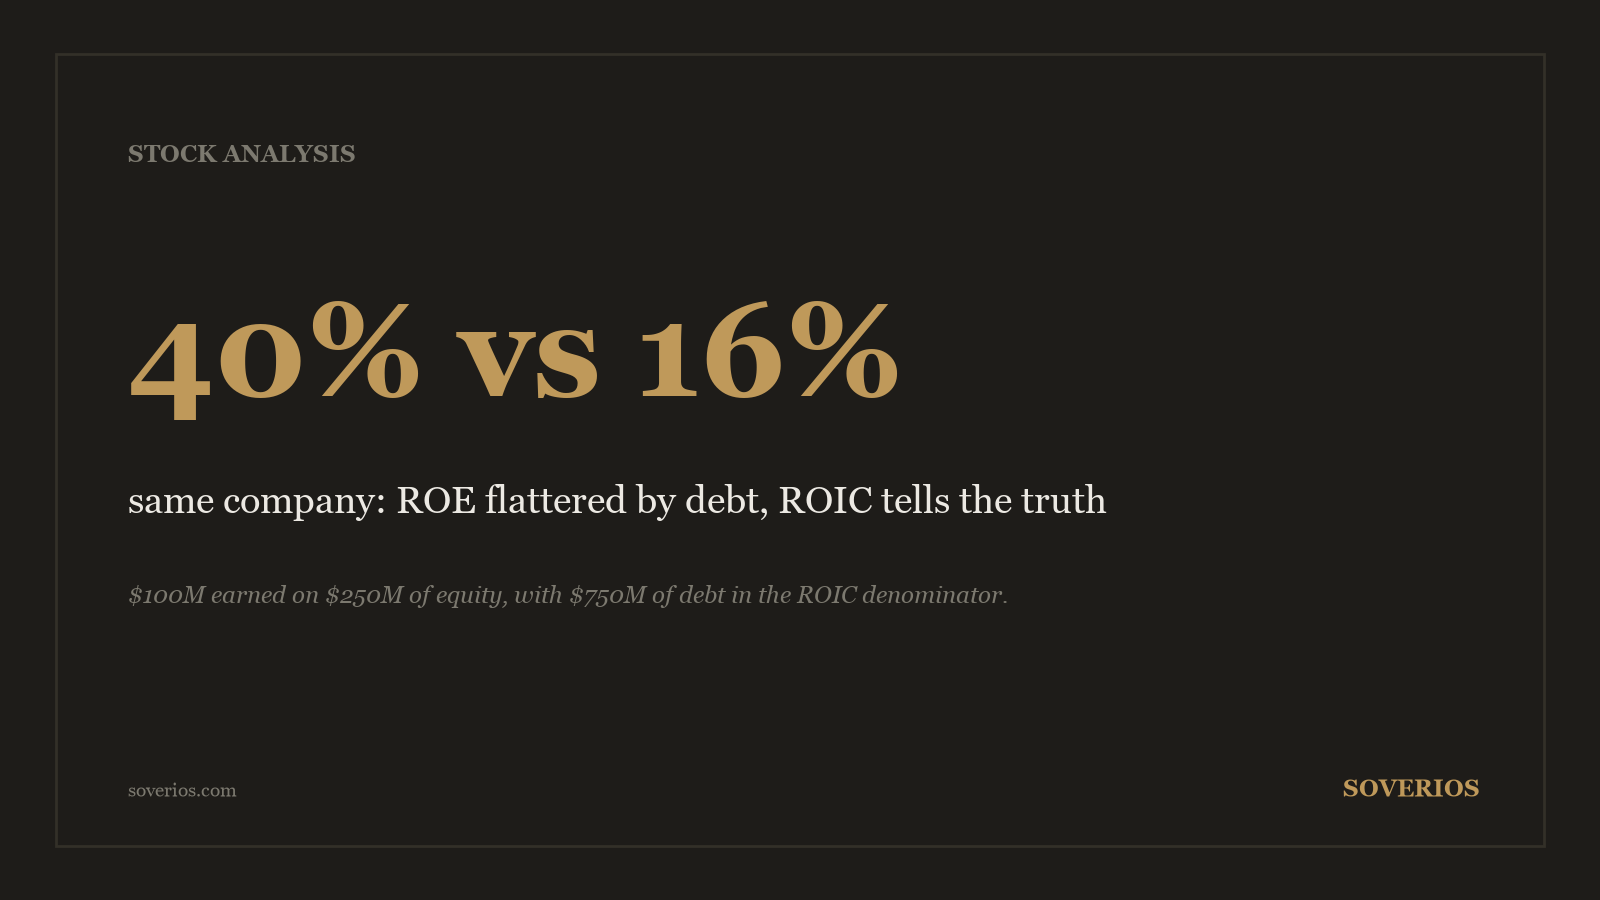
Company B also reports $100 million of net income, but it gets there differently. It earns $200 million of operating profit, pays $75 million of interest on $750 million of debt, pays $25 million of tax on the remaining $125 million, and rests on only $250 million of equity.
| Measure | Company A | Company B |
|---|---|---|
| Net income | $100M | $100M |
| Shareholders’ equity | $500M | $250M |
| Total debt | $0 | $750M |
| ROE | 20% | 40% |
| NOPAT | $100M | $160M |
| Invested capital | $500M | $1,000M |
| ROIC | 20% | 16% |
By ROE, Company B looks twice as good. By ROIC, Company A is the better business: it produces 20 cents per dollar of capital against 16 cents, with none of the fragility that a debt-to-equity ratio of 3.0 brings into a downturn.
The buyback distortion
Leverage does not need to be old to distort ROE. It can be created in a single afternoon.
Consider a hypothetical company earning $80 million on $400 million of equity, a 20 percent ROE. Management borrows $200 million and spends it on a share buyback, which reduces equity to $200 million.
Earnings have not moved, yet ROE jumps to 40 percent. Invested capital is still $400 million, now split between $200 million of equity and $200 million of debt, so ROIC has barely changed.
The same mechanism runs in reverse at companies that pay employees heavily in shares, where the equity base and share count swell each year. That hidden dilution is the subject of our guide on stock-based compensation.
Which one measures quality
Quality, for a stock picker, means the ability to reinvest profits at high rates for a long time. ROIC is the ratio built for that question, because it judges every dollar at work regardless of its source.
A durable ROIC above 15 percent is uncommon and rarely accidental. It usually signals patents, switching costs, network effects, or brands, the structural advantages that make up an economic moat, and our guide on spotting a moat in the numbers shows how to confirm one.
ROE still has a place once the balance sheet has been read. For banks and insurers, where debt is the raw material of the business rather than a financing choice, ROE remains the standard measure.
For everything else, the order matters: ROIC establishes quality, then ROE reveals how aggressively that quality is financed. High ROIC with moderate ROE means room to add debt; high ROE with low ROIC means the engineering has already happened.
Watch-outs when computing ROIC
ROIC resists manipulation better than ROE, but the inputs still demand judgment. The first trap is cash: a company sitting on a large idle cash pile earns nothing on it, so many analysts subtract excess cash from invested capital to measure the operating business alone.
The second trap is goodwill. Excluding it flatters serial acquirers by erasing the price they actually paid, so keep goodwill in the denominator when judging management and consider both versions when judging the underlying business.
The third trap is a shrinking denominator. Big write-offs reduce invested capital, which can lift ROIC in later years as a mechanical echo of past failure rather than a sign of improvement.
Finally, the marginal number beats the average. A company earning 20 percent on old capital but only 8 percent on each newly invested dollar is a business whose best economics are behind it.
How to use both numbers before buying
Run the two ratios across at least five years, not one. A single strong year proves nothing, while a five-year ROIC that never leaves double digits is hard to fake.
Then place the figures in context. Compare ROIC against the company’s own history and its direct competitors, and treat any sudden ROE jump without an ROIC jump as a balance sheet event, not a business improvement.
This pair of ratios forms one step of a larger process, laid out in our step-by-step framework for analyzing a stock. The returns test also feeds directly into the 12-metric checklist before buying any stock, where ROIC sits near the top for a reason.
One final cross-check keeps the whole exercise honest: returns should eventually arrive as cash. A company claiming a 20 percent ROIC while generating weak free cash flow yield year after year is reporting returns somewhere other than its bank account.
Frequently asked questions
Is a high ROE always a good sign?
No. ROE rises mechanically when debt replaces equity, so a 40 percent ROE can describe a leveraged average business rather than a great one. Check the debt-to-equity ratio before trusting any ROE figure.
What counts as a good ROIC?
The bar is whether the company earns more on its capital than that capital could earn elsewhere. Many quality screens look for an ROIC above 15 percent sustained across five years or more, which few companies achieve.
Why does ROIC use operating profit instead of net income?
Because the denominator includes debt, the numerator must include the profit that pays both shareholders and lenders. After-tax operating profit measures what the whole capital base produced before interest payments split it up.
Where do I find the inputs for ROIC and ROE?
All of them sit in the annual report. Net income and operating profit come from the income statement, while equity and total debt come from the balance sheet.
Educational content only, not investment advice. See our methodology and disclaimer.