Featured · Foundations
Bear Markets in History: How Long They Last, How Deep They Go
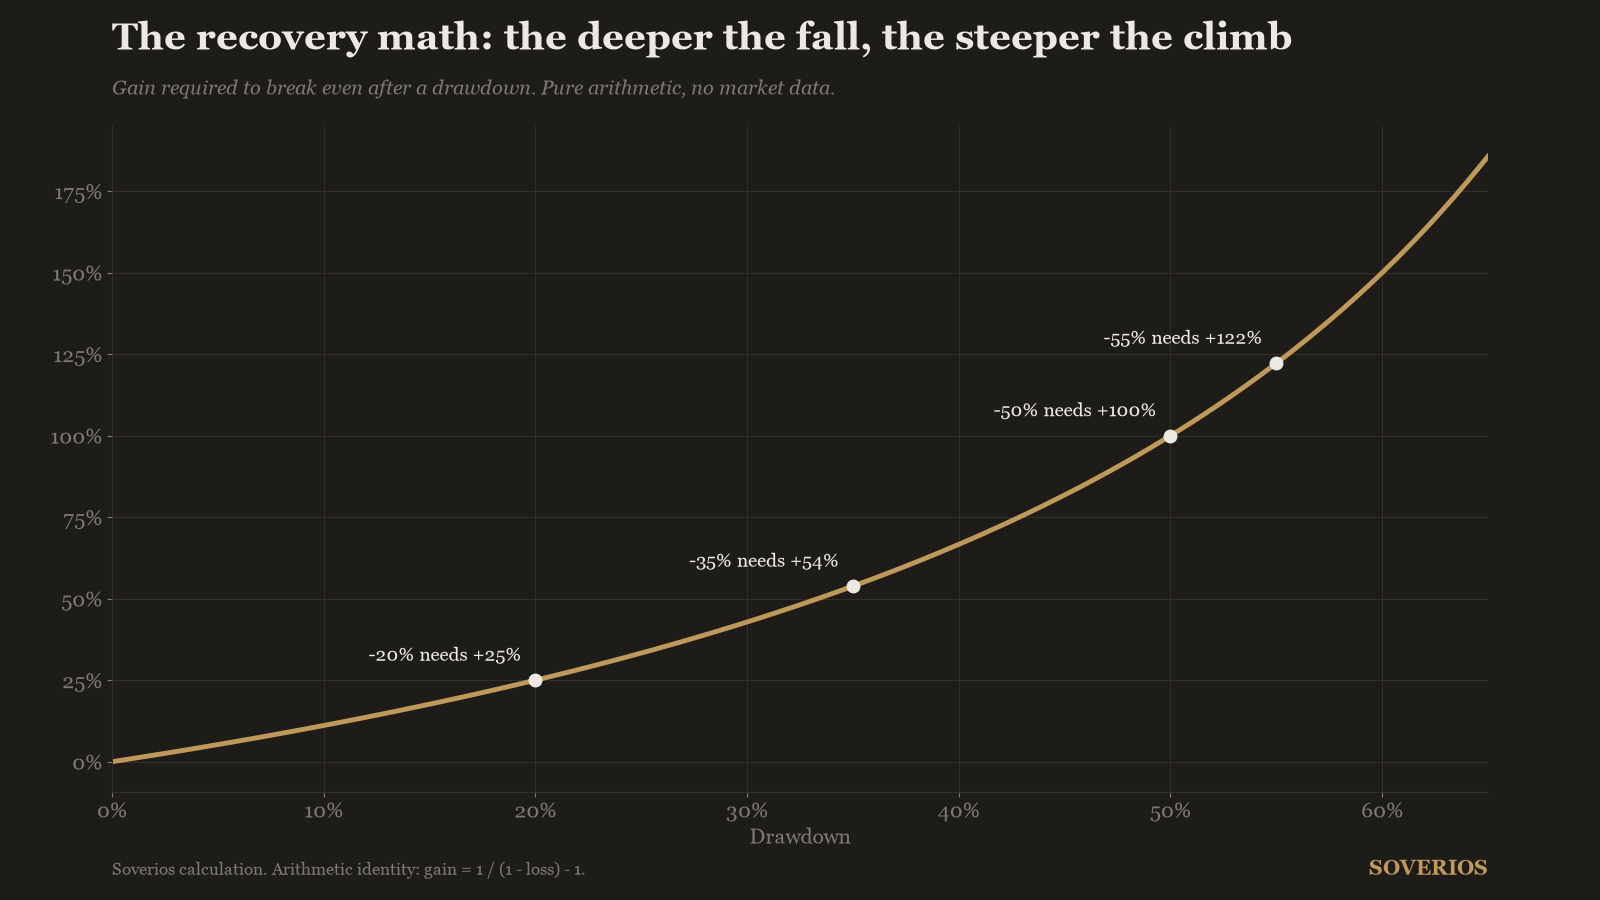
What bear market history shows: how deep the major declines went, how long they lasted, and what the recovery math demands from investors.
Analysis
What bear market history shows: how deep the major declines went, how long they lasted, and what the recovery math demands from investors.
What Dividend Aristocrats are, what the 25-year rule really filters for, and the math that decides when dividend growth beats high yield.
Tracking difference is the gap between an index fund's return and its index. It often costs more than the expense ratio. Here is how to measure it.
A high yield can signal a dividend about to be cut. Six warning signs, the payout math behind them, and a checklist to run before buying any high yielder.
Stock-based compensation is a real expense that inflates free cash flow and dilutes shareholders. Here is how to measure what it really costs you.
Doubling times, return gaps, and drawdown asymmetry: the compounding arithmetic that decides what a portfolio is worth in 30 years.
A 12-metric checklist with indicative thresholds and where to find each number in the filings, so you can screen any stock in under an hour.
Every article serves one of four ongoing investigations. Pick yours, start with the guide, then go deep.
How to read a business through its numbers: metrics, filings, red flags and valuation.
What passive investors actually own, and what the index quietly costs.
Yield, growth, payout ratios and the traps between them.
The math every stock picker should master before picking anything.
Original screens, rankings and market history from our own engine, methodology included.