Dividend Yield vs Dividend Growth: The 20-Year Math
Two dividend stocks, same $10,000 invested in each. The first yields 6% and raises its dividend 2% a year, the second yields 2% and raises it 10% a year.
Ask which one to buy and most people answer with a reflex: income investors grab the 6%, growth believers grab the 10%. The 20-year math says both reflexes are half right, and the crossover point lands later than almost anyone guesses.
Everything below is a hypothetical projection with dividends taken as cash, prices and taxes ignored, and growth rates held constant. Real companies do none of those things politely, which is where the last section comes in.
The setup: $600 now or $200 growing fast
Stock A pays $600 in year one: 6% of $10,000. Stock B pays $200, and each year the gap gets attacked from two directions, because A grows its payment 2% while B grows its payment 10%.
The question is not whether B catches up. Growing 10% against 2%, it must. The question is how long you wait, and what A pays you during the waiting.
Year by year: the crossover lands in year 16
By year 5, B has climbed from $200 to $293 while A has drifted from $600 to $650. A decade in, B still pays only about two thirds of what A pays.
The overtake finally happens in year 16, when B’s payment reaches $835 against A’s $808. The table shows the milestones per $10,000 invested.
| Year | Stock A (6% yield, 2% growth) | Stock B (2% yield, 10% growth) |
|---|---|---|
| 1 | $600 | $200 |
| 5 | $650 | $293 |
| 10 | $717 | $472 |
| 15 | $792 | $759 |
| 16 | $808 | $835 |
| 20 | $874 | $1,223 |
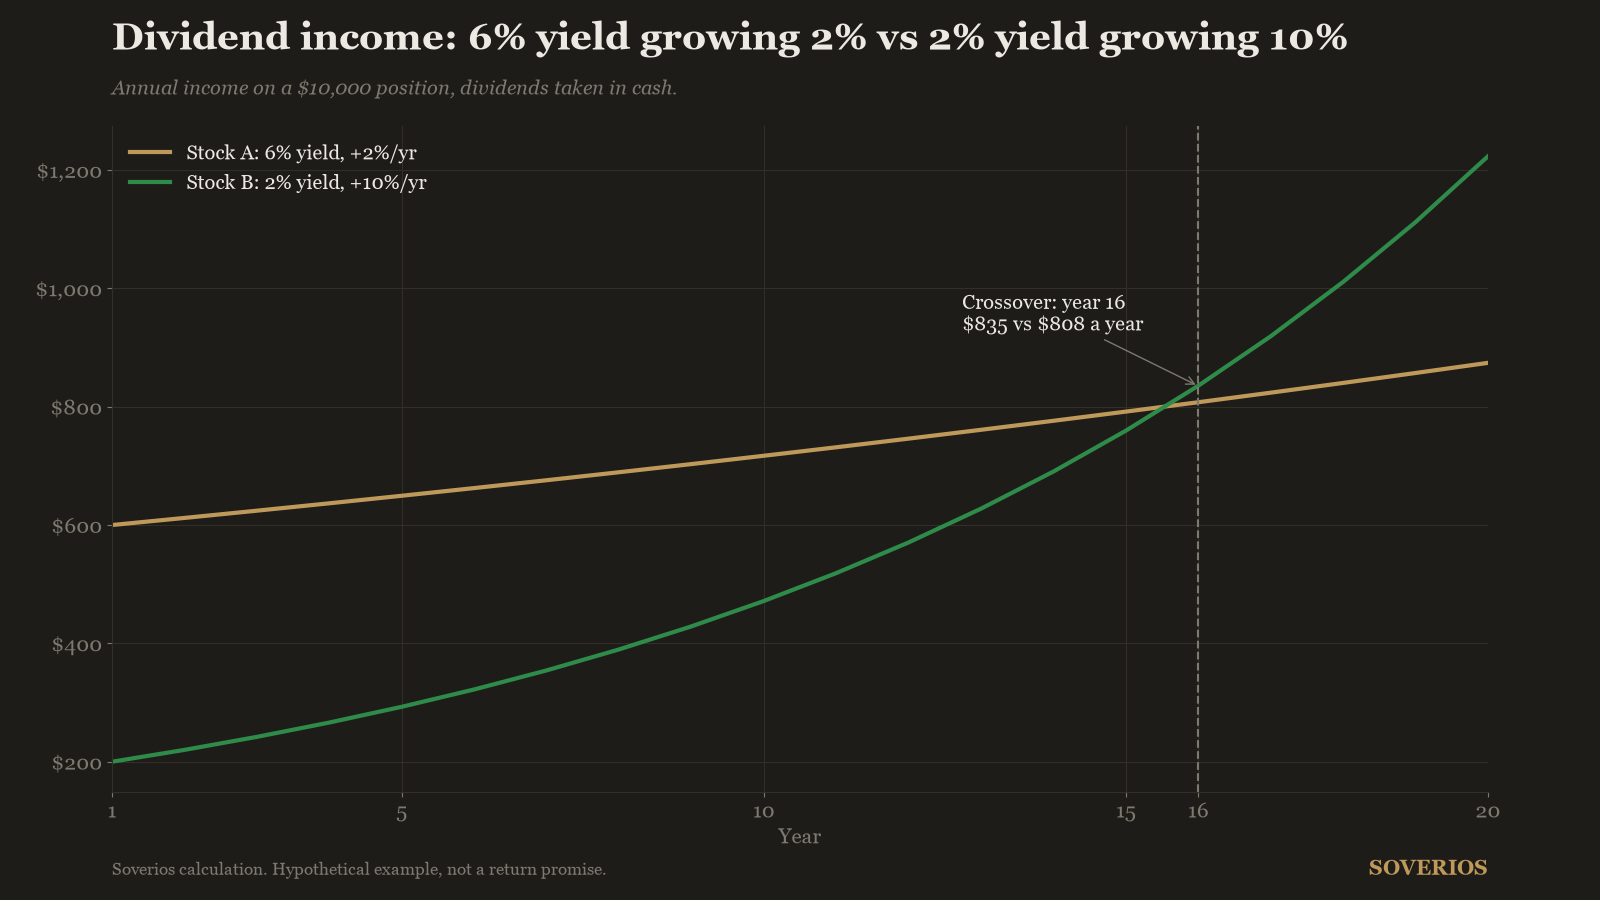
From the crossover on, the race is over: B’s lead compounds. By year 20 it pays $1,223 a year against A’s $874, a 40% higher income on the same original investment.
The number nobody checks: cumulative income
Annual income in year 20 is one scoreboard. Total cash received over the 20 years is the other, and here the high yielder still wins.
Summing every payment, Stock A delivers $14,578 in cumulative dividends and Stock B delivers $11,455. Fifteen years of much larger checks are hard to overcome in just five years of superiority.
| Metric after 20 years | Stock A | Stock B |
|---|---|---|
| Cumulative income received | $14,578 | $11,455 |
| Income in year 20 | $874 | $1,223 |
| Yield on cost | 8.7% | 12.2% |
That last row uses yield on cost: the current dividend divided by the original $10,000. B’s 12.2% against A’s 8.7% shows why the grower dominates every year beyond the table, if the growth holds.
The inflation test both stocks must pass
Nominal dollars hide a second race, because a dividend that grows 2% a year barely keeps pace with long-run US inflation. If prices rise 2.5% annually, Stock A’s growing checks actually buy a little less every year.
Deflate the year-20 payments into year-1 dollars at that 2.5% rate and the picture sharpens. Stock A’s $874 is worth about $547 of original purchasing power, below the $600 it paid in year one, while Stock B’s $1,223 is worth about $765.
| Income in year 20 | Nominal | In year-1 dollars (2.5% inflation) |
|---|---|---|
| Stock A | $874 | ~$547 |
| Stock B | $1,223 | ~$765 |
In real terms, the high yielder’s income quietly shrank about 9% over two decades. The grower’s real income nearly quadrupled from its $200 start.
Inflation does not change the crossover year, since it discounts both stocks equally. It changes what the income is worth when it arrives, and it is the strongest argument for holding at least some dividend growth even in an income portfolio built for today.
What the projection means for your timeline
If you need the income within 15 years, the high yielder funds that entire window better. A retiree drawing dividends today has little use for a payment that becomes impressive in 2042.
If the income need is 20 or more years away, the dividend growth rate matters more than today’s dividend yield. Year 25 of this projection would show B near $1,970 against A around $965, roughly double.
Most real candidates also sit between these two caricatures. Many of the long-streak raisers examined in are Dividend Aristocrats worth it pay around 2.5% and grow around 6%, a middle profile this polarized example deliberately skips.
What reinvestment does to the crossover
Everything above assumes you spend the dividends. Reinvest them instead and each check buys new shares that add their own income on top of next year’s raise.
Under simplified assumptions (the yield stays constant, so the price grows with the dividend), reinvested income compounds at roughly the growth rate plus the yield. Stock A’s income then grows about 8.1% a year (2% raises plus 6% reinvested), against about 12.2% for Stock B (10% raises plus 2% reinvested).
| Income growth per year | Cash taken | Dividends reinvested |
|---|---|---|
| Stock A | 2.0% | ~8.1% |
| Stock B | 10.0% | ~12.2% |
Here is the counterintuitive result: reinvestment pushes the crossover later, to around year 30 in this scenario, not earlier. The high yielder reinvests much bigger checks for fifteen straight years, and that head start takes the grower an extra decade to erase.
A DRIP automates the mechanics either way. For US taxpayers in a taxable account, remember that reinvested dividends are still taxed in the year received, which trims the compounding unless the shares sit in an IRA.
The assumption that breaks first
Constant growth for 20 years is the fragile part, and it is far more fragile at 10% than at 2%. A dividend growing 10% a year for two decades multiplies by 6.1, which demands earnings growth few companies sustain.
The 2% grower has the easier job, roughly matching long-run inflation. So the projection flatters Stock B: in reality, fast growers often downshift to 5% or 6% growth in their second decade, pushing the crossover past year 20 entirely.
Growth can also go to zero or below. A company that freezes its dividend turns Stock B’s entire thesis to dust, which is why the payout ratio check matters more for growers than for anyone: the whole bet rests on decades of future raises.
How a stock picker uses this table
First, classify every dividend candidate by its two numbers, current yield and 5-year dividend growth, and place it mentally on the A-to-B spectrum. This classification is step one of the selection framework in our dividend investing guide.
Second, match the stock to the date you need its income. Buying a 2% fast grower to fund next year’s expenses is a category error, and so is buying a 7% slow payer for a retirement 25 years out.
Third, stress the growth assumption before trusting it. Verify that earnings and free cash flow can fund the raises, using the tests in payout ratio: the number that predicts dividend cuts, and screen the yield itself with how to spot a dividend trap: a 6% yield only belongs in column A if it survives.
Frequently asked questions
Is a high dividend yield or high dividend growth better?
It depends on your timeline. If you need income within the next 10 to 15 years, the high yielder pays more during that entire window. If you are investing for income 20 or more years away, the grower eventually pays more per year and keeps pulling ahead.
What is yield on cost?
Yield on cost is the current annual dividend divided by the price you originally paid, not today's price. It measures what your own invested dollars now earn. A stock bought at a 2% yield whose dividend has quintupled shows a 10% yield on cost.
Can a company really grow its dividend 10% a year for 20 years?
It is rare. Sustaining 10% dividend growth for two decades requires earnings to grow at a similar pace throughout. Most fast growers slow down as they mature, which is why projections like this one are illustrations of the math, not forecasts.
Why not just buy both types of dividend stocks?
Many income investors do exactly that, pairing high yielders for current income with growers for future income. The point of the 20-year math is to size that mix deliberately, based on when you need the cash, instead of defaulting to whichever yield looks attractive.
Educational content only, not investment advice. See our methodology and disclaimer.