Bear Markets in History: How Long They Last, How Deep They Go
Every generation of investors meets at least one market that cuts their portfolio nearly in half. Knowing what those episodes actually looked like, in depth, length, and recovery, is the difference between planning for bear markets and merely fearing them.
The record since 2000 offers four full case studies with wildly different profiles. Precise peak and trough figures vary slightly by index and source, so this article sticks to verified definitions, official recession dates, and honest orders of magnitude.
What counts as a bear market
The SEC’s investor education site defines a bear market as a period when a broad market index falls by 20% or more over at least a two-month period, with pessimistic sentiment to match. The two-month clause matters: a violent one-week dip that snaps back does not qualify.
Below that threshold sits the market correction, commonly described as a decline of at least 10% from a recent high. Corrections happen far more often, and most of them never become bear markets.
The four modern bear markets
The dot-com bust was the slow one. Starting in early 2000, the market ground lower for about two and a half years, and by the late 2002 bottom the broad indexes had lost roughly half their value, with the tech-heavy Nasdaq down far more, a collapse we dissect in the dot-com bubble in numbers.
The financial crisis was the deep one. From late 2007 to early 2009, about a year and a half, the market lost more than half its value, wrapped around a recession that NBER dates from December 2007 to June 2009, and we walk through the anatomy of the 2008 crash separately.
The 2020 crash was the fast one. The market shed about a third of its value in roughly five weeks, alongside a recession NBER dates from February to April 2020, just two months from peak to trough.
The 2022 episode was the orderly one. Rising rates dragged the market down by roughly a quarter over most of a year, with no NBER-dated recession attached at all.
| Bear market | Approximate depth | Approximate length |
|---|---|---|
| Dot-com bust, 2000-2002 | Around half | About two and a half years |
| Financial crisis, 2007-2009 | More than half | About a year and a half |
| Covid crash, 2020 | About a third | Roughly five weeks |
| Inflation bear, 2022 | About a quarter | Most of a year |
Four episodes, four completely different shapes. Any plan built for the average bear market would have fit none of them.
Note what the table deliberately avoids: precise index levels and exact percentage declines. Those figures differ by index, by data vendor, and by whether intraday or closing prices are used, so orders of magnitude are the honest resolution here.
The recovery math
Depth matters more than duration, because losses compound against you. A drawdown must be recovered from a smaller base, so the required rebound is always larger than the decline that caused it.
| Drawdown | Gain needed to break even |
|---|---|
| 20% | 25% |
| 35% | 54% |
| 50% | 100% |
| 55% | 122% |
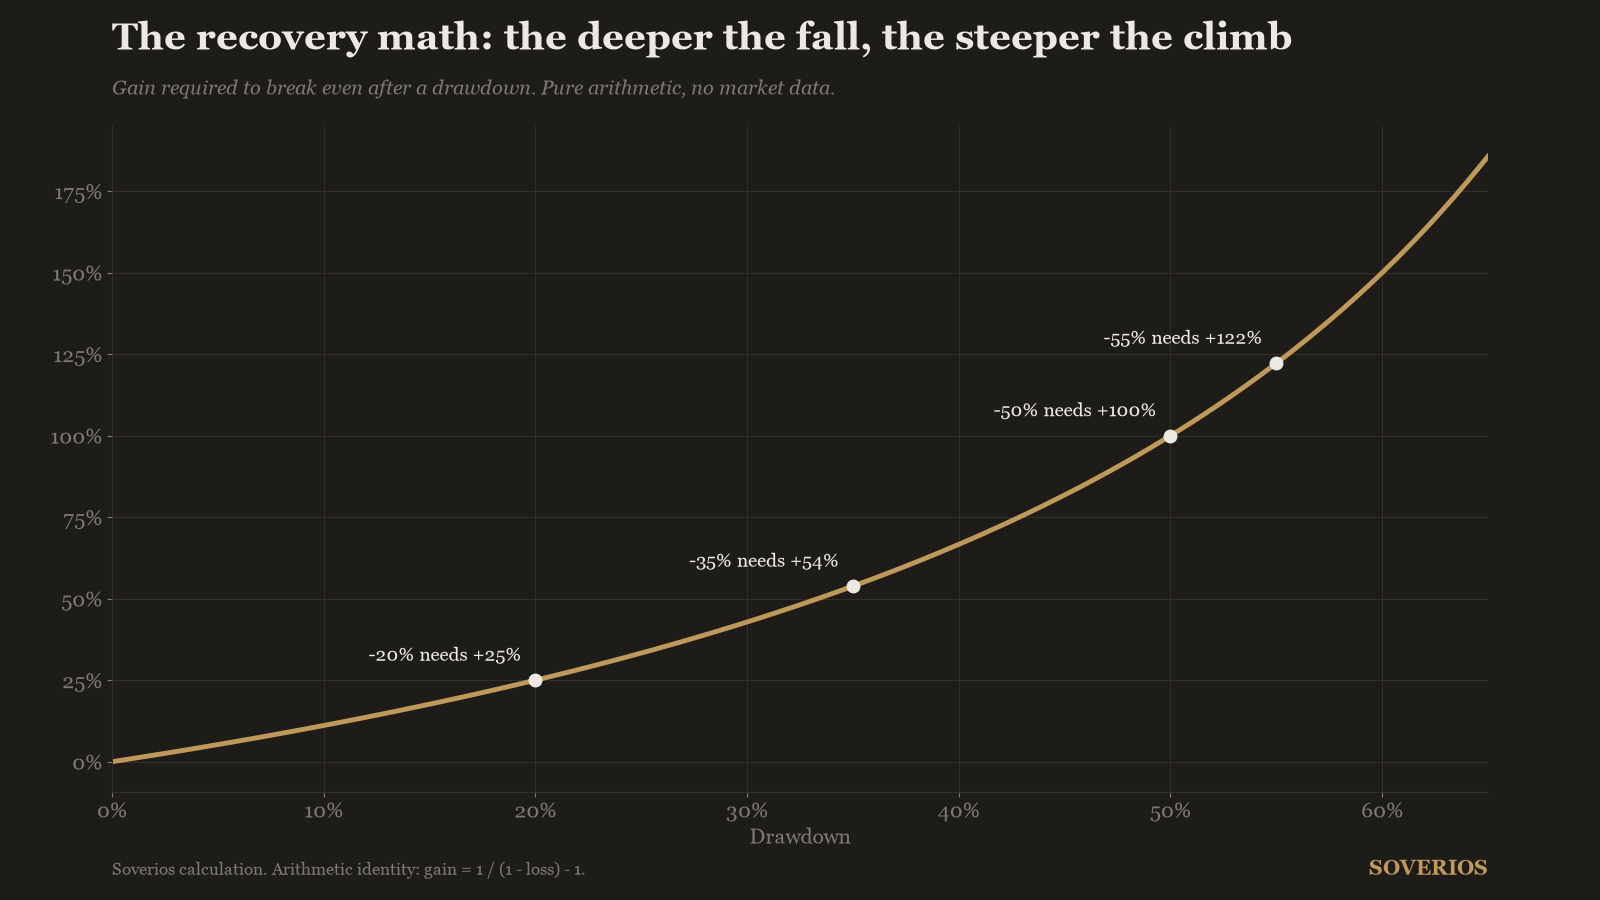
This is why the two halvings of the 2000s each took years of subsequent gains to repair, while the shallow, fast 2020 decline was repaired within months. The full arithmetic of that asymmetry is in the compounding math every stock picker should know.
The table also explains why depth, not fear, should set your risk budget. An investor who cannot afford a multi-year recovery has no business being positioned for a 50% drawdown.
The time cost of depth
Break-even percentages translate into years. Assume a hypothetical recovery compounding at 8% a year from the bottom, and the calendar cost of each drawdown becomes explicit.
| Drawdown | Gain needed | Years at 8% to break even |
|---|---|---|
| 20% | 25% | About 3 |
| 35% | 54% | About 5.6 |
| 50% | 100% | About 9 |
Nine years at a steady 8% just to reclaim the old high: that is what a halving costs even when the recovery cooperates. Depth converts directly into lost time, which is the real constraint for anyone approaching the date they need the money.
The flip side is that shallow declines are cheap. A 20% bear repaired at market-like returns costs about three years, which a long-horizon investor can absorb without changing anything.
How often bear markets arrive
Four bear markets in the 25 years since 2000 averages out to one every six years or so, but the spacing is anything but regular. More than a decade separated the 2009 bottom from the 2020 crash, while the 2020 and 2022 episodes came within three years of each other.
The practical reading: a multi-decade investor should expect to sit through several bear markets without any way to schedule the encounters. That expectation belongs in the plan from day one, not improvised mid-decline.
Bear markets and recessions overlap imperfectly
It is tempting to treat bear markets as the market’s recession forecast, but the record is messier. NBER, the official arbiter of US business cycles, dated the 2001 recession from March to November 2001, only eight months inside a bear market that ran years longer.
The 2022 bear market had no dated recession at all, and the 2020 recession lasted two months. A recession call is also useless as a trading signal, since NBER announces turning points long after the fact.
Anyone hoping to sidestep bear markets by forecasting the economy is playing the timing game with worse information than they think. We price what that game costs in time in the market vs timing the market.
What history rewards inside a bear market
The pattern across all four episodes is that the bull market that followed began while the news was still terrible, amid maximum volatility. Nobody rings a bell at the bottom, which argues for behavior that does not require finding it.
Continuing to buy on schedule through a decline turns falling prices into an advantage, since equal dollars buy more shares at the lows. The falling-market arithmetic in dollar-cost averaging vs lump sum shows a steady buyer finishing a hypothetical down year in profit.
How a stock picker prepares
Preparation beats prediction, and it starts with what you already own. Businesses with strong balance sheets and durable cash generation survive the recession that may accompany the next bear market; leveraged and cash-burning ones may not get the chance to recover.
Second, structure yourself so you are never a forced seller: cash needs matched to their dates, no leverage that turns a drawdown into a margin call. The recovery math only works for investors still holding at the rebound.
Third, keep a researched watchlist with the prices you would pay. Bear markets are when quality businesses finally trade at those prices, and acting on prepared work while others panic is one of the few genuine edges in beating the market.
Frequently asked questions
How is a bear market different from a correction?
The dividing line is depth. A correction is commonly described as a decline of at least 10% from a recent high, while a bear market is generally defined as a fall of 20% or more sustained over at least two months. Corrections are far more frequent and most never deepen into bear markets.
How long does a typical bear market last?
There is no reliable typical figure, because the range is huge. The modern extremes run from roughly five weeks in 2020 to about two and a half years during the dot-com bust. Planning around an average would have misled an investor in either episode.
Do bear markets always come with recessions?
No. The 2022 bear market arrived without any NBER-dated recession, while the 2007-2009 bear market wrapped around a recession that NBER dates from December 2007 to June 2009. The overlap is common but not guaranteed in either direction.
Can you wait for the recession call before selling?
Not usefully. NBER dates business cycle turning points months or years after the fact, so the official recession call arrives long after markets have already moved. By the time a recession is declared, much of the associated market decline has typically already happened.
Educational content only, not investment advice. See our methodology and disclaimer.
Sources: www.investor.gov · www.nber.org