Dollar-Cost Averaging vs Lump Sum: What the Data Says
You have cash to invest. Do you put it all in today, or feed it in over months? If your expected return on stocks is positive, the math favors investing promptly: on average, waiting costs more than it saves.
That is the whole result, but averages hide a lot. Dollar-cost averaging wins clearly in falling markets, and it solves a behavioral problem that pure arithmetic ignores. Both cases deserve real numbers.
The trade-off in one sentence
The SEC’s investor education site defines dollar-cost averaging as investing equal amounts at regular intervals, regardless of market moves. The alternative, a lump sum, means full exposure from day one.
Every dollar on a deployment schedule spends part of the year in cash. If stocks are expected to out-earn cash, that idle time has a price, and compound interest magnifies it over time.
A rising market, quarter by quarter
Take a hypothetical $12,000 and a hypothetical stock that climbs steadily through the year. The dollar-cost averager invests $3,000 at the start of each quarter; the lump sum investor buys everything at $100 on day one.
| Quarter | Share price | $3,000 buys |
|---|---|---|
| Q1 | $100 | 30.00 shares |
| Q2 | $105 | 28.57 shares |
| Q3 | $110 | 27.27 shares |
| Q4 | $115 | 26.09 shares |
The averager ends the year with 111.93 shares, worth $12,872 at the final $115 price. The lump sum investor holds 120 shares worth $13,800.
That is a $928 gap, or 7.2% more wealth, from a single year of steady gains. Stretch the same logic over a longer schedule and the shortfall grows with it.
Nothing exotic happened here: the averager simply paid more per share each quarter, finishing with an average cost of $107.21 against $100 for the lump sum. In a market that trends up, later purchases are systematically worse purchases.
A falling market flips the result
Now run the same $12,000 through a bad year: the stock drops from $100 to $50, then claws back to $80.
| Quarter | Share price | $3,000 buys |
|---|---|---|
| Q1 | $100 | 30.00 shares |
| Q2 | $80 | 37.50 shares |
| Q3 | $50 | 60.00 shares |
| Q4 | $80 | 37.50 shares |
The averager accumulates 165 shares at an average cost of $72.73, worth $13,200 at year end, a 10% gain in a down market. The lump sum investor holds 120 shares worth $9,600, a 20% loss.
The mechanism is visible in the share counts: the $3,000 installment bought twice as many shares at $50 as at $100. Equal dollars buy more when prices are low, which is the entire advantage of averaging.
A sideways market: volatility’s small gift
There is a third case worth pricing: a market that ends the year where it started but swings along the way. Run the same $12,000 through a dip-and-recover path.
| Quarter | Share price | $3,000 buys |
|---|---|---|
| Q1 | $100 | 30.00 shares |
| Q2 | $90 | 33.33 shares |
| Q3 | $110 | 27.27 shares |
| Q4 | $100 | 30.00 shares |
The averager ends with 120.61 shares worth $12,061 at the final $100 price, while the lump sum investor is exactly flat at $12,000. The $61 edge appears because equal dollar installments automatically overweight the cheap quarters.
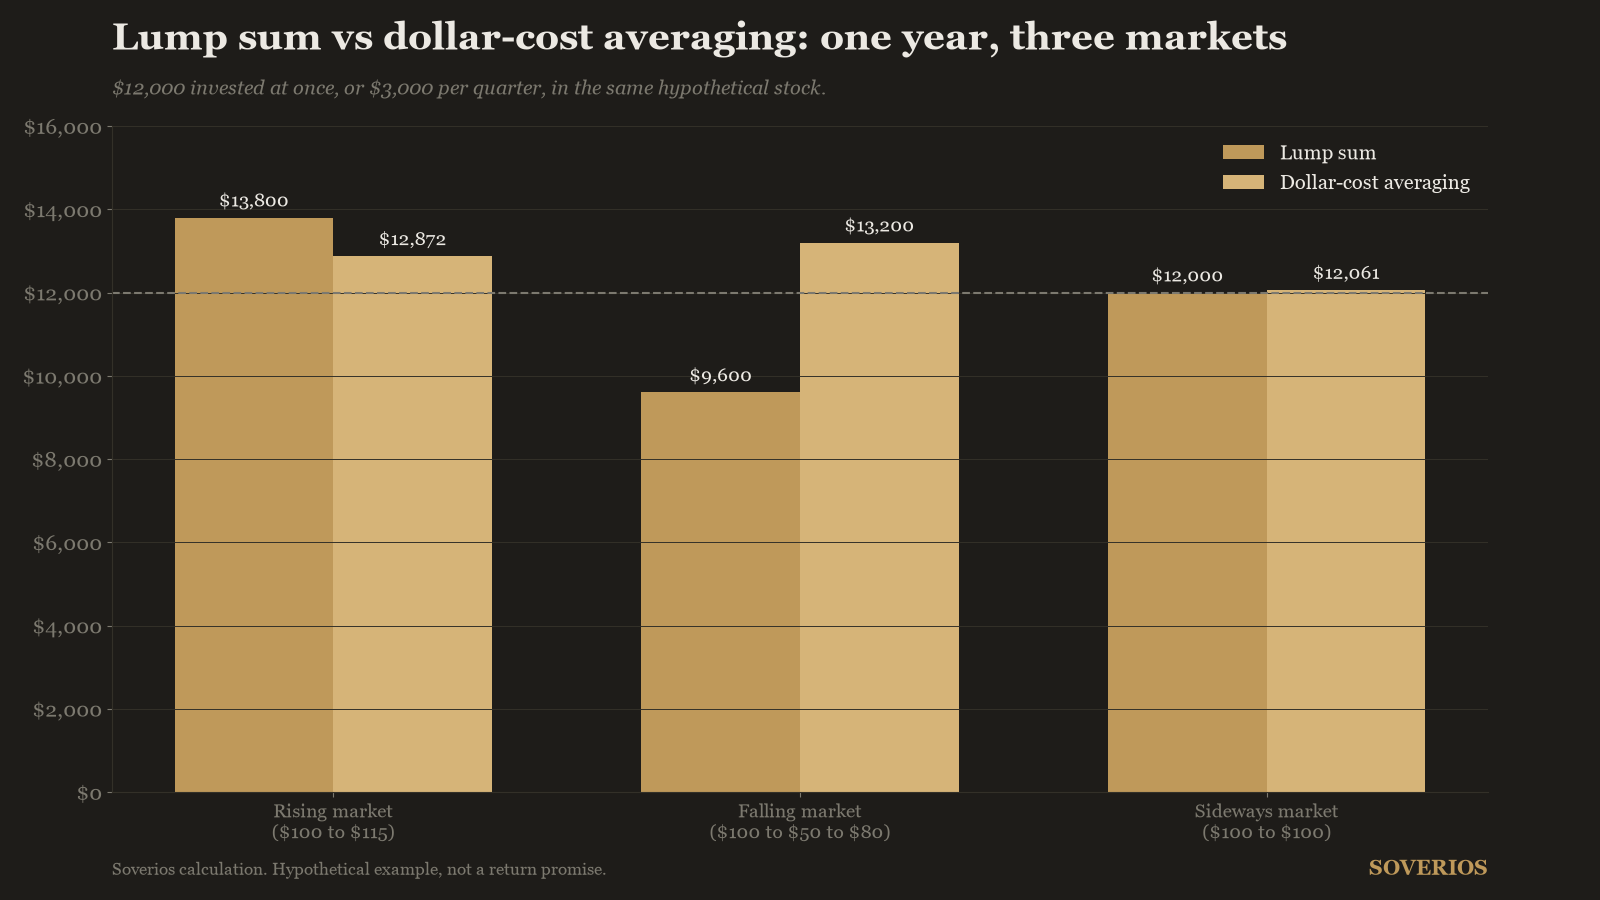
The general rule behind all three examples: your average cost per share always sits at or below the simple average of your purchase prices. The choppier the path, the wider that gap, though in a trending market the trend dominates the effect.
What the data actually says
Notice that neither scenario required a study. An asset with a positive expected return rewards early exposure, so lump sum wins on average by construction; averaging wins in the minority of periods when prices fall during deployment.
The average dollar in a 12-month schedule spends about half the year uninvested. The longer the schedule, the larger the expected shortfall, and the better the protection if a decline arrives, as it eventually does in every cycle documented in our review of bear markets in history.
Stretching the calendar makes the trade worse in both directions at once. A 24-month schedule doubles the average idle time of each dollar while still offering no guarantee that the decline, if it comes, arrives during your window rather than the month after it closes.
One more honest nuance: these examples assume you already hold the cash. Most people invest out of each paycheck, which looks like averaging but is really just investing money as it arrives, the soundest version of the practice.
The behavioral half of the answer
The arithmetic assumes an investor who executes flawlessly and feels nothing. Real investors feel losses roughly twice as intensely as equivalent gains, the pattern known as loss aversion.
Put a full windfall to work the week before a 20% drop and the temptation to sell everything, and never return, is real. The averager who faces the same drop is partly in cash, buying at lower prices, and far more likely to stay the course.
That is worth paying for. A plan with a slightly lower expected return that you actually follow beats an optimal plan you abandon in the first bear market.
Automation strengthens the effect. A standing monthly order removes the decision point entirely, which means there is no moment for a scary headline to intervene between the plan and its execution.
How to put money to work
For long-horizon money, the numbers point one way: prompt investment carries the higher expected value, and a multi-year cash drip is an expensive comfort. Splitting the difference, deploying over a few months rather than years, caps both the regret and the cost.
The honest way to frame that compromise: it is insurance. You accept a modest expected shortfall in exchange for protection against the specific scenario, investing everything right before a plunge, that does the most behavioral damage.
Whatever the schedule, the worst option is the permanent wait for a better entry, which is market timing by another name. We price that mistake, missed rebound days and compounding drag included, in time in the market vs timing the market.
For a stock picker, averaging has a second use: building a researched position in stages smooths out a single name’s volatility while leaving room to add if the price gets more attractive. The discipline that matters is matching the money to your time horizon and knowing why you own the business at every price you paid.
Either way, the deployment schedule is a side decision. The returns that make beating the market possible come from what you buy, a point the compounding math makes concrete in dollar terms.
Frequently asked questions
Does dollar-cost averaging guarantee a lower average cost?
It guarantees your average cost per share sits below the simple average of the prices on your purchase dates, because equal dollar amounts buy more shares when prices are low. It does not guarantee a profit, and it does not protect a position in a business that keeps deteriorating.
How long should a dollar-cost averaging schedule run?
The longer the schedule, the longer cash sits out of the market, so the expected shortfall against a lump sum grows with the calendar. Investors who spread a windfall often keep the window short, a matter of months rather than years, to cap that cost.
Is lump sum investing riskier than dollar-cost averaging?
Over the deployment window, yes: full exposure from day one means taking the full hit if prices fall immediately. Once the averaging schedule ends, both investors are fully invested and carry identical market risk from that point on.
Does dollar-cost averaging work for individual stocks?
The mechanics work the same, and spreading buys smooths out a single stock's price swings. The caveat is averaging down into a business whose fundamentals are breaking: adding on schedule only makes sense while the original thesis still holds.
Educational content only, not investment advice. See our methodology and disclaimer.
Sources: www.investor.gov