Beating the Market: What It Actually Takes
Every investor who buys an individual stock is making a quiet claim: that this choice will do better than simply owning everything. Beating the market is that claim taken seriously, measured, and tested against a benchmark that never gets tired.
Most people who make the claim fail. The reasons are not mysterious: costs compound against you, index returns lean on a few big winners, and human behavior breaks at exactly the wrong moments.
This guide is the entry point to our Foundations series. It defines the goal honestly, walks through the math working against you, and lays out what the job requires when you attempt it anyway.
What counts as beating the market
The market, for a US stock picker, means a broad benchmark: in practice the S&P 500 with dividends reinvested. Beating it means your return, after every fee and every tax, exceeds that total return over a meaningful stretch.
Each of those qualifiers has teeth. Dividends included, because the index’s cash payouts are part of its return; after costs, because you pay them and the benchmark does not; over years, because any single year is mostly noise.
Professionals call the excess return alpha. Whatever you call it, it is a spread between two numbers, and both numbers have to be measured honestly for the spread to mean anything.
Taxes belong in the measurement for the same reason fees do. For US taxpayers, every sale in a taxable account can trigger capital gains tax, which means high-turnover strategies must clear a higher bar than buy-and-hold ones just to break even with the index.
The first headwind: costs compound against you
An index fund can be nearly free to own. Active management, whether a fund’s fee or your own trading costs, is not, and the difference compounds exactly the way returns do.
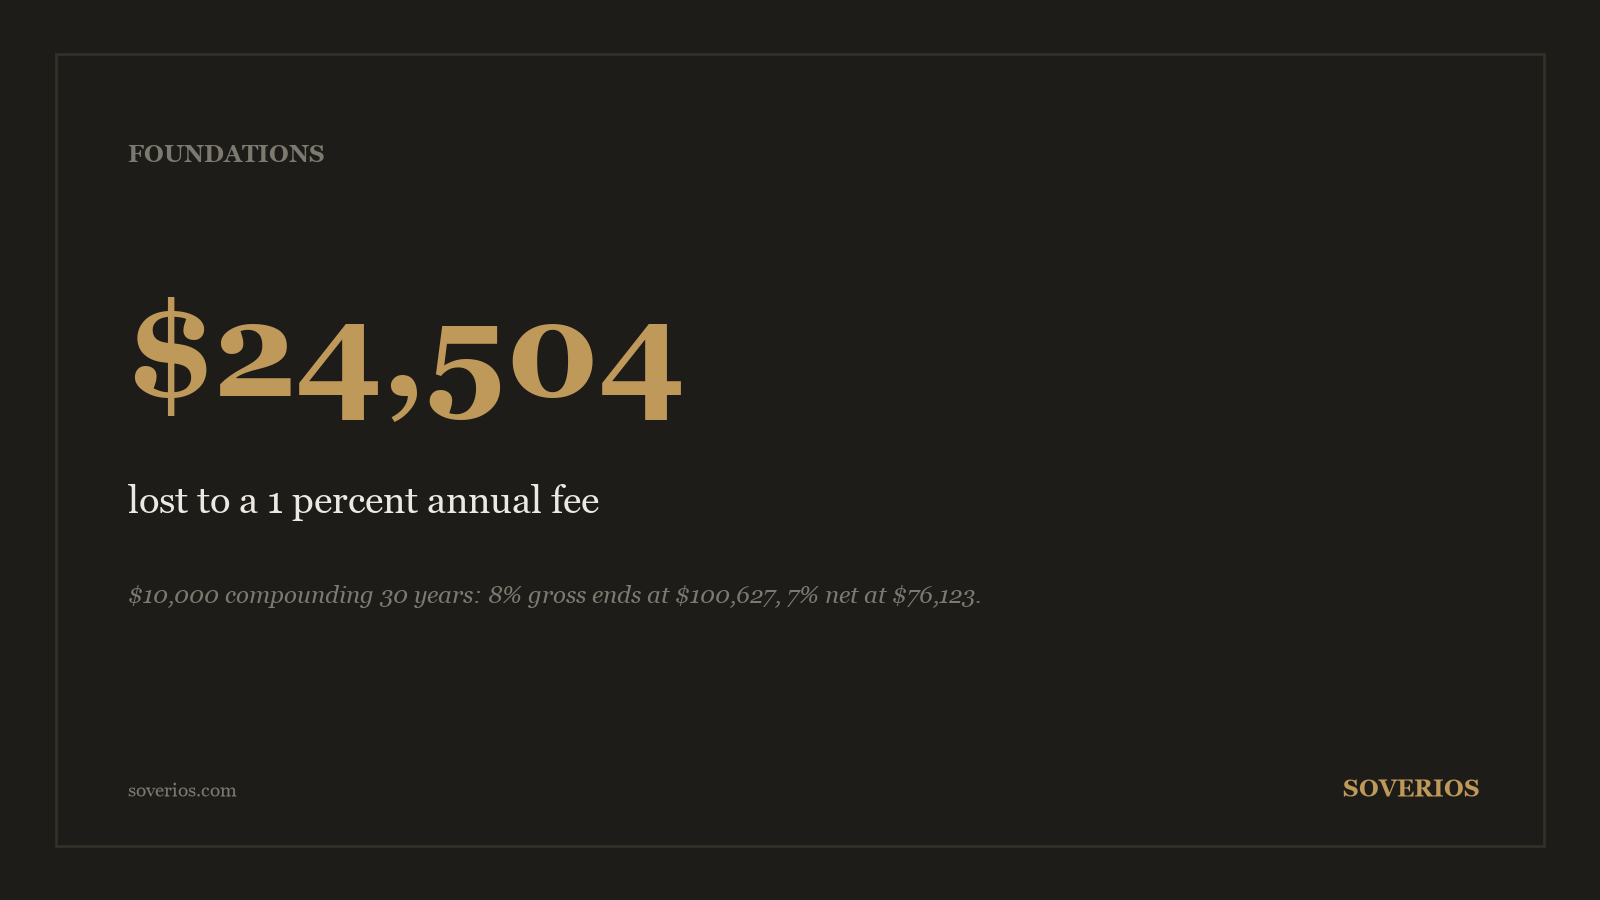
Suppose the market delivers 8 percent a year for 30 years and you invest $10,000. A 1 percent annual cost drag lowers your compounding rate to 7 percent; a 2 percent drag, fees plus trading, lowers it to 6 percent.
| Annual return after costs | $10,000 after 30 years | Lost to costs |
|---|---|---|
| 8% (no drag) | $100,627 | $0 |
| 7% (1% drag) | $76,123 | $24,504 |
| 6% (2% drag) | $57,435 | $43,192 |
A quarter of the final wealth gone at 1 percent of drag, over 40 percent gone at 2 percent. The full mechanics of why small rates produce huge end differences are in the compounding math every stock picker should know, and the expense ratio you pay any fund manager sits on the wrong side of that ledger.
This is the core reason most funds trail their benchmark. Before a manager can beat the market for you, they must first beat the market plus their own fee, every single year.
The second headwind: a few winners carry the index
Market returns are not spread evenly across stocks. In any long period, a minority of companies do most of the heavy lifting while many others go nowhere, and an index owns the winners automatically.
A stock picker has to find them on purpose. Consider a hypothetical 10-stock portfolio, $1,000 in each position, held for 10 years: nine stocks compound at a pedestrian 5 percent while one compounds at 20 percent.
| Holding | Value after 10 years | Share of final portfolio |
|---|---|---|
| 9 stocks at 5%/yr | $14,660 | 70.3% |
| 1 stock at 20%/yr | $6,192 | 29.7% |
| Total | $20,852 | 100% |
The single winner turns 10 percent of the capital into almost 30 percent of the outcome, and lifts the whole portfolio from 5 percent to 7.6 percent a year. Replace that one pick with another 5 percent stock and the portfolio earns 5 percent, full stop.
This skew is also what passive investors are quietly relying on, a point examined from the other direction in The Index Reality Check. For the active investor the lesson is blunt: selling your winners early is how market-beating portfolios become market-trailing ones.
The third headwind: your own behavior
The math above assumes you hold for 30 years without flinching. Real investors meet real bear markets, and declines of 30 percent or more are a recurring feature of stock market history, not an anomaly.
Selling into a decline converts a temporary drawdown into a permanent loss, then adds a second error: being in cash for the recovery. The historical record of how long declines last and how deep they go is laid out in Bear Markets in History.
The related temptation is jumping in and out to dodge the bad stretches. The evidence against that habit, and what missing a handful of the best days does to long-run returns, is covered in time in the market vs timing the market.
Even the decision of how to enter the market has a behavioral answer and a mathematical one. We compare them in dollar-cost averaging vs lump sum.
The honest case for not trying
Add up the three headwinds and the rational default for most people is a cheap, broad index fund. It captures the winners automatically, keeps costs near zero, and removes most opportunities to sabotage yourself.
That is not a concession this site makes reluctantly; it is the baseline any serious stock picker must accept. The market return is free, so the burden of proof sits entirely on any decision to deviate from it.
Beating the market is not a reasonable expectation for someone picking stocks casually on tips and headlines. It is a possible outcome for someone doing deliberate, repeated, documented work.
What it actually takes
If you attempt it, four requirements do the separating.
An edge you can name
An edge is a specific reason you expect to be righter than the price. It comes in three forms: informational (you know something the market underweights), analytical (you interpret public numbers better), or behavioral (you can hold when others must sell).
For an individual, the honest options are the second and third. Analytical edge starts with reading financial statements yourself, beginning with what free cash flow is and extending to free cash flow yield as a valuation lens.
It also means staying inside your circle of competence: the industries where you can actually judge whether a business is getting stronger or weaker. A step-by-step method for that judgment is our framework on how to analyze a stock.
Concentration with a checklist
Owning 60 stocks is indexing with extra fees and extra effort. A portfolio that can beat the market has to differ from the market, which means meaningful positions in a limited number of well-understood businesses.
Concentration without process is gambling, so the discipline lives in the checks you run before every purchase. Ours is codified in the 12-metric checklist before buying any stock.
Costs and turnover kept near zero
The fee table above does not stop applying because you manage your own money. Frequent trading rebuilds the 1 to 2 percent drag through spreads and taxes, handing back your edge in small, invisible slices.
Low turnover is not laziness; it is the individual investor’s structural advantage. No quarterly redemptions, no career risk, no pressure to look busy.
A time horizon measured in years
Compounding at 7.6 percent instead of 5 percent, as in the 10-stock example, produced its gap over a decade. Nothing about an edge shows up reliably in a quarter, and a strategy abandoned in year two returns whatever the exit price says, not what the thesis was worth.
Patience is only a virtue when the underlying work was sound. The compound interest arithmetic rewards the combination, not either half alone.
Keeping score honestly
The final discipline is measurement, because self-deception is the cheapest way to feel like you are beating the market. Compute your money-weighted return each year, subtract nothing, excuse nothing, and set it against the S&P 500 total return for the same period.
Small spreads are worth measuring because they compound into large dollar gaps. Suppose your picks earn 9 percent a year for five years while the benchmark earns 8 percent: on $10,000 that is a modest-sounding edge worth $693.
| Portfolio | Annual return | $10,000 after 5 years |
|---|---|---|
| Your picks (hypothetical) | 9% | $15,386 |
| Benchmark (hypothetical) | 8% | $14,693 |
Stretch the same 1 percent spread to 30 years and the gap grows to $24,504, the fee table from earlier running in your favor for once. That is the entire economic case for doing this work: a small, persistent edge, compounded for decades.
Run the comparison over rolling five-year windows and include at least one bear market before concluding anything. If the spread is negative after five honest years, the index fund was the better tool, and knowing that is worth more than pretending otherwise.
If the spread is positive, you have earned the only version of the claim that matters: measured, after costs, against the benchmark that never gets tired.
Frequently asked questions
What does beating the market actually mean?
It means your portfolio's total return, after fees and taxes, exceeds a relevant benchmark's total return over a meaningful period. For US stock pickers the standard benchmark is the S&P 500 with dividends reinvested. One good year proves little; five or more years start to mean something.
Why do most professional fund managers fail to beat the index?
They carry costs the index does not: management fees, trading costs, and cash held for redemptions. They also compete against each other, so their trades largely cancel out before costs. Subtract 1 to 2 percent of annual drag from a market return and trailing the index becomes the expected outcome.
Can individual investors realistically beat the market?
Some can, but the conditions are strict: low costs, a genuine edge in specific companies, concentration in best ideas, and the temperament to hold through drawdowns. An individual's structural advantages are patience and no career risk. Without the work, an index fund is the rational default.
How long should I measure performance before drawing conclusions?
Five years is a minimum and a full market cycle, including a bear market, is better. Short windows mostly measure luck and sector exposure. Track your money-weighted return against the S&P 500 total return over the same period, and let the comparison include every cost you actually paid.
Educational content only, not investment advice. See our methodology and disclaimer.
Sources: www.investor.gov · www.investor.gov