Expense Ratios: What They Really Cost You Over 20 Years
An expense ratio of 1.00% sounds like pocket change. On a hypothetical $100,000 portfolio compounding at 7% for 20 years, it removes $66,254 from your final balance, well over half of the original investment.
That $66,254 is not just fees. Roughly $36,800 leaves the account as fees collected, and the remaining $29,500 is growth that money would have produced if it had stayed invested.
This article walks through the math at four fee levels, splits the cost into its two parts, and compares the result with the SEC’s own published example.
What an expense ratio is and how it gets paid
An expense ratio is the annual percentage of fund assets that the manager keeps to run an ETF or mutual fund. A 0.50% ratio on $100,000 of fund assets means $500 in the first year.
You never see an invoice. The fee is skimmed from the fund’s assets daily, so it appears only as a return slightly lower than the index the fund tracks.
Two features make it costly. It is charged on assets under management, not on results, so it applies in full during losing years, and it compounds, because every dollar taken today also removes that dollar’s future growth.
The 20-year math on $100,000
Take a hypothetical $100,000 portfolio whose holdings grow at 7% a year for 20 years. With no fee at all, it reaches $386,968.
Now subtract the expense ratio from the annual return, which is how fee drag works in practice. A fund charging 0.03% compounds at 6.97%, a fund charging 1.00% compounds at 6.00%, and the gap widens every year.
| Expense ratio | Value after 20 years | Cost vs no fee |
|---|---|---|
| 0.00% | $386,968 | $0 |
| 0.03% | $384,804 | $2,164 |
| 0.20% | $372,756 | $14,212 |
| 0.50% | $352,365 | $34,603 |
| 1.00% | $320,714 | $66,254 |
The relationship is not linear. A fee 33 times larger (1.00% vs 0.03%) produces a final cost about 31 times larger, because each extra basis point removes money that would itself have compounded.
Stretch the horizon to 30 years and the gap explodes
Retirement money often compounds for 30 years or more, and fee drag accelerates as the horizon lengthens. Run the same hypothetical portfolio for one extra decade and the cost of the 1.00% fund nearly triples.
| Expense ratio | Value after 30 years | Cost vs no fee |
|---|---|---|
| 0.00% | $761,226 | $0 |
| 0.03% | $754,849 | $6,377 |
| 0.50% | $661,437 | $99,789 |
| 1.00% | $574,349 | $186,877 |
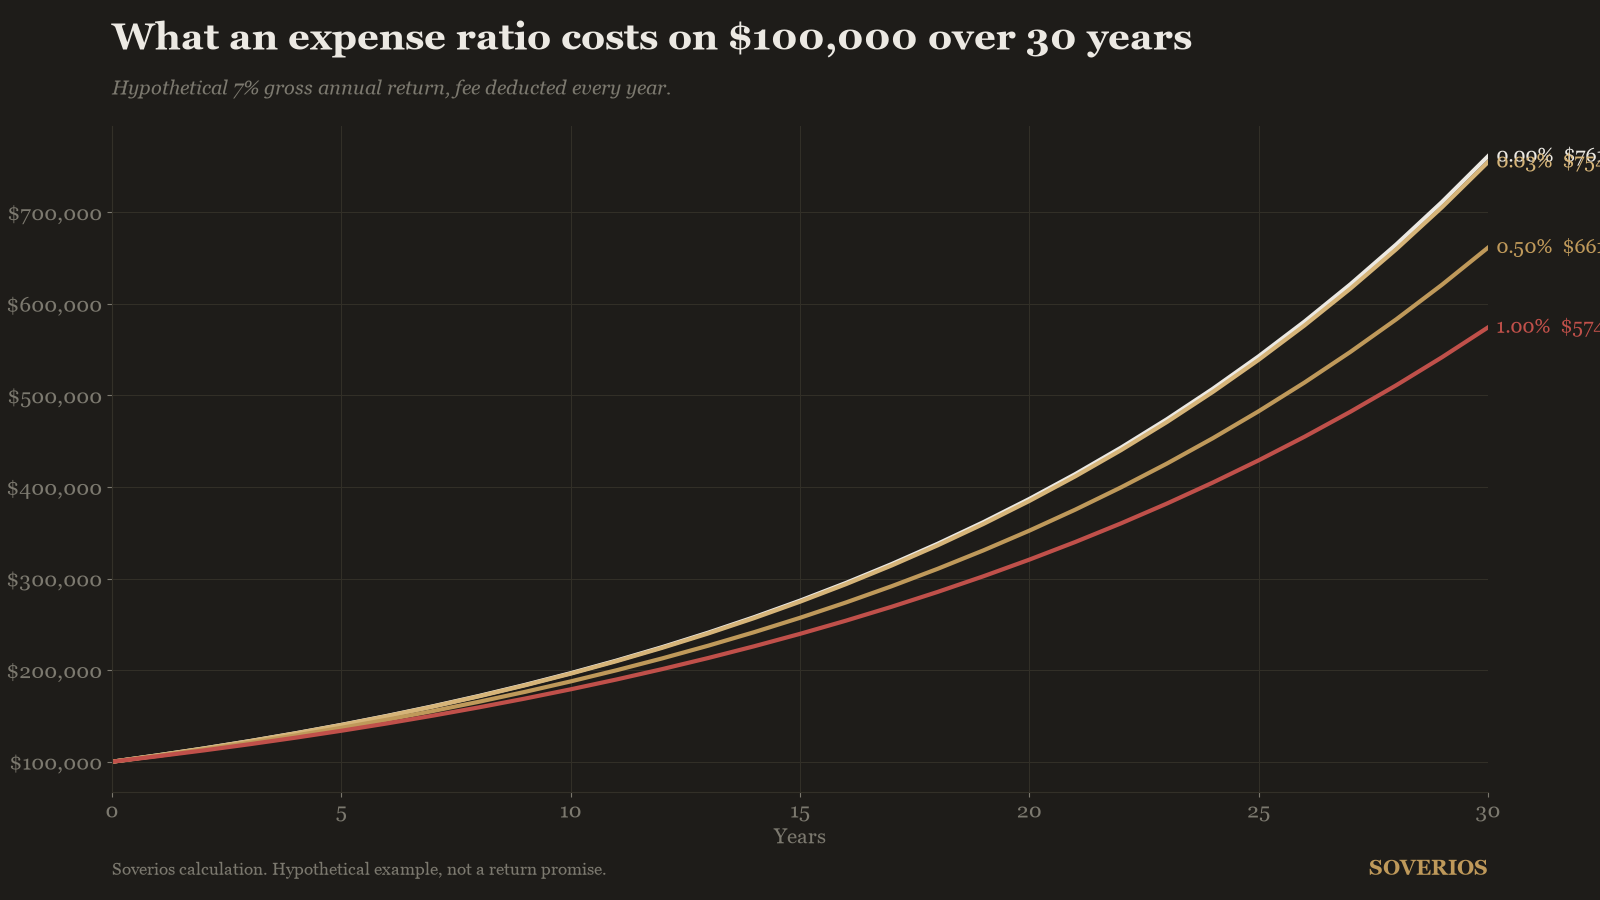
At 30 years, the 1.00% fund has surrendered $186,877, or almost twice the original investment. The 0.50% fund, often marketed as cheap, quietly gives up six figures.
Where the $66,254 actually goes
Split the 1.00% case into its two components. Assume the fund takes its fee on the balance at the start of each year while the assets grow 7% over that year, which nets out to exactly 6% growth.
Under that assumption, the fees collected across 20 years total $36,786. The remaining $29,468 was never paid to anyone: it is the compounding those fee dollars would have earned had they stayed in the portfolio.
| Component | Amount | Share of total cost |
|---|---|---|
| Fees collected by the fund | $36,786 | 55.5% |
| Growth the fee money never earned | $29,468 | 44.5% |
| Total cost | $66,254 | 100% |
This second component is the part most investors never price in. Almost half the damage comes from compound interest working for the fund company instead of for you, a mechanic covered in more detail in the compounding math every stock picker should know.
What the SEC’s own example shows
The SEC’s investor education site runs the same exercise with more conservative assumptions: a $100,000 portfolio growing 4% a year for 20 years. With a 0.25% annual fee, the portfolio ends near $208,000.
At 0.50%, it ends near $198,000, and at 1.00% near $179,000. Even at a modest 4% growth rate, the jump from 0.25% to 1.00% in fees costs roughly $30,000, close to a third of the starting capital.
Monthly savers are not spared
The math punishes ongoing contributions the same way. Suppose an investor adds $6,000 at the end of every year for 20 years into funds earning 7% before fees.
| Expense ratio | Value after 20 years | Cost vs no fee |
|---|---|---|
| 0.00% | $245,973 | $0 |
| 0.03% | $245,169 | $804 |
| 0.50% | $232,952 | $13,021 |
| 1.00% | $220,714 | $25,259 |
The percentages are smaller than in the lump-sum case because later contributions compound for fewer years. The dollar cost is still five figures at 0.50% and above.
Fees do not pause in flat markets
Because the charge applies to assets rather than results, a fund collects its full fee through every losing or sideways year. Suppose a hypothetical fund’s holdings return exactly 0% a year for a decade.
A 1.00% expense ratio shrinks a $100,000 stake to $90,438 over those ten flat years. The same decade in a 0.20% fund ends at $98,018, so the investor pays $9,562 against $1,982 for identical gross performance.
That asymmetry is worth remembering during bear markets. The manager’s revenue falls only as far as the asset base does, while your return goes negative by exactly the fee.
Why a 0.03% fund still is not free
To be fair to the cheap end of the market: a broad index fund at 0.03% is one of the best deals in finance. In the hypothetical above it costs $2,164 over 20 years, a rounding error next to the $66,254 of the 1.00% product.
But the expense ratio is not the only leak. Funds also lag their benchmark through trading costs, cash drag, and sampling choices, a gap explained in tracking difference, the index fund fee you never see.
And the fee buys a specific product: the index’s return, minus costs, with no judgment applied to what you own. What that bundle includes is the subject of our index reality check, and what it excludes is covered in what ETF investors give up.
What to do with these numbers
First, find the expense ratio of every fund you own: it is in the fund’s summary prospectus and on any quote page. Multiply it by your balance to see the current annual charge in dollars, then remember that charge grows with your assets under management, not with the value the manager adds.
Second, demand something for every basis point above the cheapest alternative. A 1.00% fund must beat a 0.03% fund by 0.97 points every single year just to tie, before considering that the index itself is more concentrated than most buyers realize.
Third, apply the same discipline to yourself if you pick stocks. Zero-commission brokers have made the direct route cheap, but your real costs are taxes on turnover and the hours of work each position demands.
Returns are uncertain, but fee schedules are printed in advance. Fees are the one variable in investing you control completely, so control it.
Frequently asked questions
Is a 0.50% expense ratio high?
For a broad index fund, yes: the largest S&P 500 trackers charge under 0.10%. For an active or specialized fund, 0.50% is common, but in the hypothetical 20-year example it still costs a $100,000 portfolio $34,603 in lost final value.
How is an expense ratio actually charged?
The fund deducts it from assets a little each day before calculating its net asset value. You never receive a bill, which is exactly why the cost is easy to ignore. It shows up only as a slightly lower return.
Do expense ratios matter if the fund performs well?
Yes, because the fee compounds against you regardless of performance. Every dollar taken in year one also removes the growth that dollar would have earned for the next 19 years.
What is a good expense ratio for an index fund?
Broad US index funds are available below 0.10%, and several large ones charge 0.05% or less. Above 0.20% for a plain S&P 500 or total-market tracker, you are paying for something the cheapest funds deliver for a fraction of the price.
Educational content only, not investment advice. See our methodology and disclaimer.
Sources: www.investor.gov