Free Cash Flow Yield: The Metric Serious Investors Watch
Every valuation metric tries to answer one question: how much business do you get for the price? Free cash flow yield gives the most literal answer available, in actual cash.
It divides the cash a company produces, after paying its bills and funding its equipment, by what the market charges for the whole company. Expressed as a percentage, it reads like an interest rate on your investment, which is exactly how serious investors use it.
How to calculate it
The formula needs two inputs, both public. Take free cash flow from the cash flow statement and divide it by market capitalization.
FCF yield = free cash flow / market capitalization
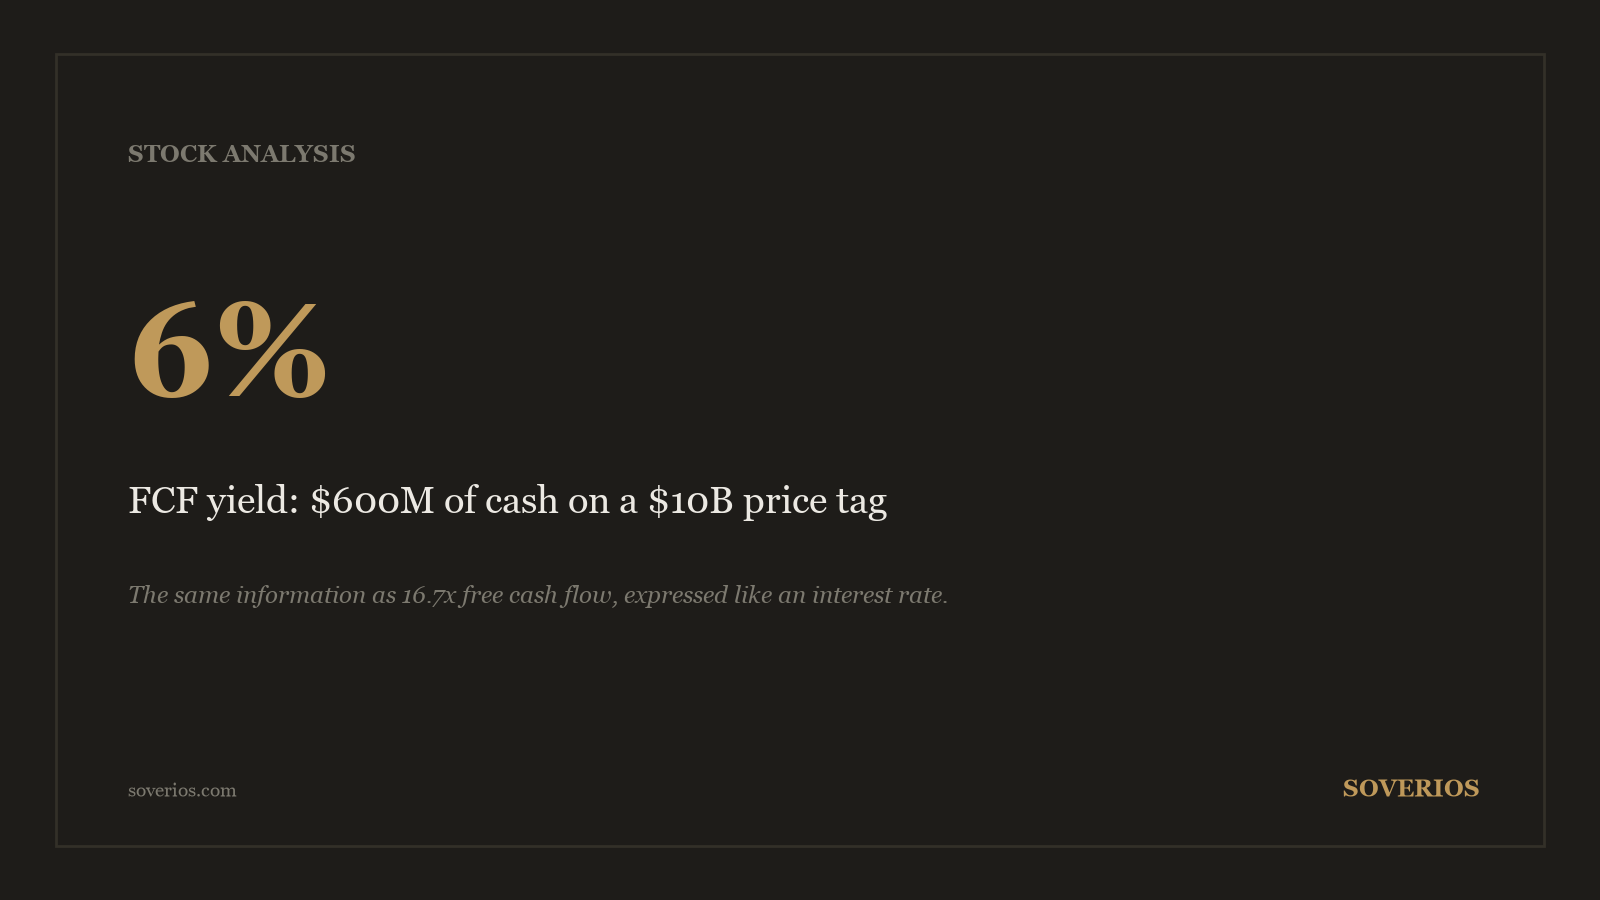
Suppose a hypothetical company generates $600 million of free cash flow and the market values its equity at $10 billion. Its FCF yield is 6 percent.
The same fact can be flipped into a multiple. A 6 percent yield means you are paying about 16.7 times free cash flow, since 1 divided by 0.06 is 16.7.
If the numerator is unfamiliar territory, start with our plain-English guide to free cash flow. The one-line version: operating cash flow minus capital expenditures, both taken from the cash flow statement.
Why it beats the P/E ratio for cash checks
The P/E ratio compares price to reported earnings, and earnings are the end product of many accounting judgments. Depreciation schedules, provisions, and revenue timing all shape the number before you ever see it.
Free cash flow is harder to dress up, because cash either arrived or it did not. That difference turns FCF yield into a lie detector for valuations that look reasonable on earnings.
Consider three hypothetical companies, each valued at $10 billion and each reporting $500 million of net income. On a P/E basis they are triplets: all trade at 20 times earnings, an earnings yield of 5 percent.
| Company | Net income | Free cash flow | FCF yield |
|---|---|---|---|
| A | $500M | $650M | 6.5% |
| B | $500M | $500M | 5.0% |
| C | $500M | $250M | 2.5% |
Company A converts more than every earnings dollar into cash, while Company C converts only half. Identical P/E ratios, and yet A offers 2.6 times the cash return of C at the same price.
Where P/E and its cousins still earn their keep is covered in our comparison of EV/EBITDA and the P/E ratio. The point is not to discard earnings metrics but to make them pass the cash test.
The enterprise value variant
Market capitalization prices the equity alone and ignores the debt the business carries. Two companies with the same market cap can be very differently priced once borrowing enters the picture.
The fix is to swap the denominator for enterprise value, which adds net debt (total debt minus cash) to market cap. This version asks what yield a buyer of the entire business, debts included, would receive.
Compare two hypothetical firms, each with a $10 billion market cap and $600 million of free cash flow. Firm A carries no net debt, while Firm B carries $3 billion.
| Firm | Market cap | Net debt | Enterprise value | FCF / EV |
|---|---|---|---|---|
| A | $10B | $0 | $10B | 6.0% |
| B | $10B | $3B | $13B | 4.6% |
On the equity version both yield 6 percent, but the enterprise version shows Firm B is meaningfully more expensive. When you compare companies with different debt loads, the enterprise version is the honest one.
The logic is the same one that makes EV-based multiples useful elsewhere in valuation. Debt is a claim on the business that ranks ahead of you, so a price that ignores it flatters every borrower.
When a high yield is a trap
A fat yield is an invitation to investigate, not a conclusion. Three situations produce high FCF yields that punish buyers.
The first is underinvestment. A company can inflate free cash flow for several years simply by starving capital expenditures, which boosts today’s yield by quietly liquidating tomorrow’s business.
The second is the stock-based compensation blind spot. The standard calculation adds SBC back to cash flow, and our article on the true cost of stock-based compensation shows how a 6 percent yield can shrink dramatically once you charge for it.
The third is the cycle. Commodity and industrial businesses print their fattest cash flows at the peak, so a double-digit yield on peak earnings can evaporate within two years.
The common cure is history. Average free cash flow over five or more years, and demand that the business quality justify the price, which is where checking for an economic moat in the numbers pairs naturally with this metric.
What the yield buys you over time
FCF yield is often confused with dividend yield, and the difference matters. Dividend yield measures what management chooses to pay out, while FCF yield measures what the business could pay out, fund buybacks with, or reinvest.
That makes FCF yield the ceiling on every form of shareholder return. A company yielding 6 percent in free cash flow can sustainably pay a 6 percent dividend at most, and a dividend above the FCF yield is being financed by debt or dilution.
The metric also compounds when the business grows. Buy a hypothetical stock at a 6 percent FCF yield, let free cash flow grow 5 percent a year, and after ten years the company generates about 9.8 percent of your original purchase price in cash annually.
| Year | FCF per $100 invested | Yield on original cost |
|---|---|---|
| 0 | $6.00 | 6.0% |
| 5 | $7.66 | 7.7% |
| 10 | $9.77 | 9.8% |
That progression is the quiet argument for pairing a decent starting yield with a growing business. The starting number sets the floor, and growth does the rest.
How the stock picker uses it
Compute the yield yourself from the cash flow statement rather than trusting a screener, because screeners rarely adjust for anything. Subtract stock-based compensation, then average the numerator over five years for anything cyclical.
Judge the result against your alternatives. A stock’s FCF yield competes with what bonds pay and with every other stock on your list, and a yield that only matches risk-free rates leaves you unpaid for equity risk unless real growth is coming on top.
Then track the trend, not the snapshot. A 5 percent yield on cash flow growing steadily beats an 8 percent yield on cash flow in decline, because next year’s yield on your purchase price will already look different.
Used this way, FCF yield becomes the pricing discipline of a complete process, from business quality through valuation, laid out in our step-by-step framework for analyzing a stock. It will not find the story stocks, which is the point: it finds the ones that pay.
Frequently asked questions
What is a good free cash flow yield?
There is no universal threshold: the yield competes against bond yields and against other stocks. The practical questions are whether the yield beats what safer assets pay, and whether the underlying free cash flow is sustainable rather than inflated by underinvestment.
Is free cash flow yield better than the P/E ratio?
It is more demanding. Earnings reflect accounting choices, while free cash flow tracks actual cash after investment needs. Companies with identical P/E ratios can have very different FCF yields, and that gap is precisely what the metric reveals.
Should I use market cap or enterprise value in the denominator?
Market cap answers what the equity holder gets. Enterprise value, which adds net debt, answers what a buyer of the whole business gets, and it punishes debt-heavy companies. Comparing firms with different debt loads calls for the enterprise value version.
Can free cash flow yield be misleading?
Yes. A company can inflate free cash flow for a few years by cutting capital expenditures, and the standard calculation ignores stock-based compensation. Cyclical companies also show their fattest yields right at the top of the cycle.
Educational content only, not investment advice. See our methodology and disclaimer.