Anatomy of the 2008 Crash: The Numbers Behind the Collapse
Between October 2007 and March 2009, the S&P 500 lost almost 57 percent of its value. That single number understates the experience: the decline came in waves, punctuated by failed banks, emergency legislation, and days when the market moved more in hours than it normally does in months.
This study walks through the crash in verified numbers: the timeline, the depth, the policy response, and the damage to the real economy. The goal is not nostalgia. It is to give today’s stock picker a calibrated sense of what a true systemic bear market looks like.
The timeline: from peak to panic
The strange part of 2008 is how quietly it started. The Federal Reserve made its first emergency move on September 18, 2007, cutting its target rate by 50 basis points to 4.75 percent, and the S&P 500 still closed at its all-time peak near 1,565 three weeks later, on October 9, 2007.
The recession began that December, by the National Bureau of Economic Research’s official dating. Yet the market spent most of the next nine months in an orderly decline, not a panic. The panic arrived in September 2008.
| Date | Event |
|---|---|
| September 18, 2007 | Fed cuts rates 50 basis points to 4.75 percent |
| October 9, 2007 | S&P 500 closes at its peak, near 1,565 |
| December 2007 | Recession begins (NBER dating) |
| March 2008 | Bear Stearns collapses, sold to JPMorgan in a Fed-backed deal |
| September 15, 2008 | Lehman Brothers files for bankruptcy |
| September 29, 2008 | House rejects the first bailout vote; the Dow drops roughly 7 percent in one session |
| October 3, 2008 | TARP signed into law, authorizing up to $700 billion |
| December 16, 2008 | Fed cuts its target to a range of 0 to 0.25 percent |
| March 9, 2009 | S&P 500 bottoms at 676.5, down almost 57 percent |
Lehman’s bankruptcy on September 15, 2008 was the hinge. Once a major investment bank was allowed to fail, every institution’s promises became suspect, and liquidity drained out of markets that normally never make headlines.
Two weeks later, on September 29, the House of Representatives rejected the first vote on the rescue package. The Dow lost roughly 7 percent in a single session, and Congress passed the Troubled Asset Relief Program days later, authorizing up to $700 billion.
The autumn that followed rewrote the definition of a bad day. NBER research on the crisis counted 29 trading days with moves larger than 3 percent between late September and the end of 2008, a clustering of volatility with almost no modern precedent.
How deep the hole was
From 1,565 to 676.5 is a decline of almost 57 percent. For a hypothetical $100,000 portfolio tracking the index, that meant watching the balance shrink to about $43,200 in 17 months.
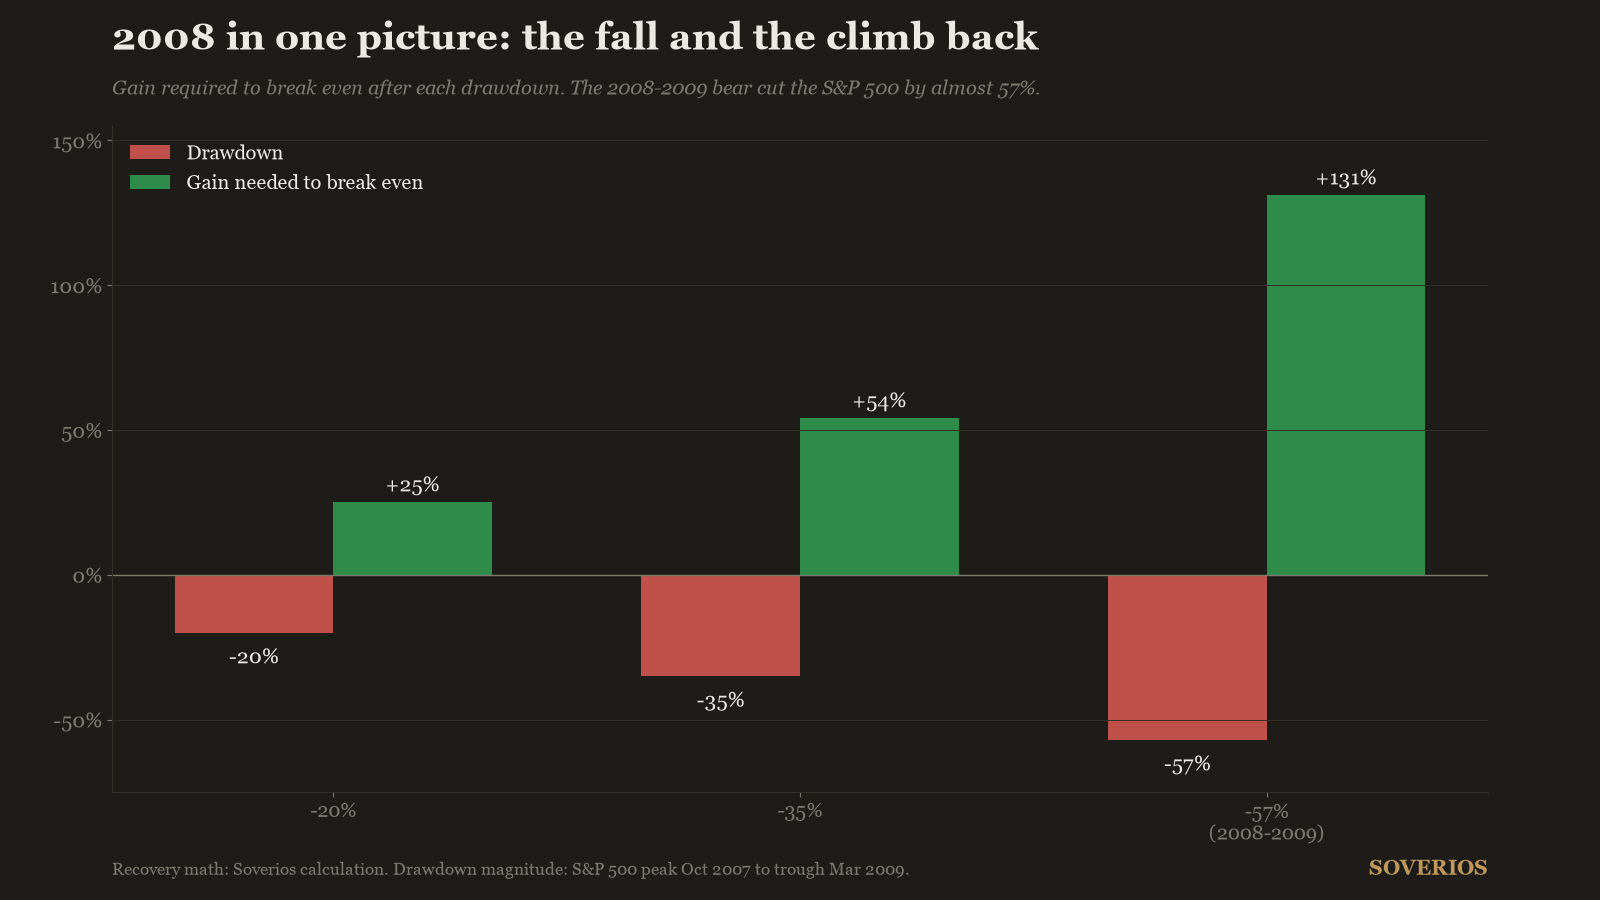
The arithmetic of a drawdown is brutally asymmetric. Losing 57 percent means the portfolio must gain roughly 131 percent just to return to its starting point, because the recovery is computed on a much smaller base.
| Drawdown | Gain needed to break even |
|---|---|
| -20% | +25% |
| -35% | +54% |
| -57% (2008-2009) | +131% |
That is why the recovery took years even though the rebound off the bottom was fast. The S&P 500 did not reclaim its October 2007 level until early 2013, more than five years after the peak.
Compared with other episodes, 2008 sits near the top of the modern severity table. Our companion study on bear markets in history shows the average postwar bear market losing far less; only the crash of 1929 and the dot-com collapse of 2000 to 2002 belong in the same conversation.
The two great modern bear markets also differed in shape. The dot-com bust was deeper for the Nasdaq but slower, while 2008 compressed comparable index damage into half the time.
| Episode | Peak to trough | Headline decline |
|---|---|---|
| Dot-com bust, 2000 to 2002 | 31 months | Nasdaq down almost 78% |
| Financial crisis, 2007 to 2009 | 17 months | S&P 500 down almost 57% |
The policy response in numbers
The Federal Reserve’s reaction gives the cleanest measure of how bad policymakers thought things were. In fifteen months, the Federal Reserve took its target rate from 4.75 percent to effectively zero.
The December 16, 2008 decision was without precedent: a target range of 0 to 0.25 percent, the lowest in the institution’s history to that point. The Fed paired it with emergency lending facilities and, soon after, large-scale asset purchases.
| Date | Fed funds target |
|---|---|
| September 17, 2007 | 5.25% |
| September 18, 2007 | 4.75% |
| December 16, 2008 | 0 to 0.25% |
Fiscal policy moved on a similar scale. TARP authorized up to $700 billion to stabilize banks, an amount later reduced by the Dodd-Frank Act, and the Treasury eventually recovered the bulk of what it deployed.
The damage beyond the ticker
Stock prices recovered. Jobs took far longer.
By NBER dating, the recession ran 18 months, from December 2007 to June 2009, the longest US contraction since World War II. Unemployment, which stood near 5 percent when the recession began, kept rising after it officially ended and peaked at 10.0 percent in October 2009, according to the Bureau of Labor Statistics.
By that October, payroll employment had already fallen by more than 7 million from the start of the recession, and BLS data show the number of unemployed workers had grown by 8.2 million over the same stretch. Housing wealth collapsed alongside, with national home prices falling by roughly a quarter from their peak.
This lag matters for investors. The market bottomed in March 2009 while the economic news was still getting worse, a reminder that prices turn on expectations, not on headlines.
What held up, and what did not
The crash was not uniform. Financial stocks were nearly wiped out as a group, while businesses with steady cash flow and little debt fell hard but survived intact.
The companies that emerged strongest shared traits you can screen for today: durable free cash flow, manageable debt, and revenue that did not depend on cheap credit. The warning signs on the losing side, ballooning balance sheets and earnings propped up by one-time gains, are exactly what a disciplined reading of financial statement red flags is designed to catch.
Diversification within equities offered limited shelter, since nearly everything fell together at the worst moments. What varied enormously was what happened after: the survivors compounded from the bottom, and the impaired businesses never came back.
What 2008 teaches the stock picker
The first lesson is arithmetic, not psychology. Position sizes and cash reserves should be set so that a 50 percent broad-market decline is survivable without forced selling, because 2008 proved such declines happen to modern, regulated, well-analyzed markets.
The second lesson is that balance sheets decide who survives. An investor who follows a step-by-step analysis framework and refuses companies dependent on continuous refinancing had a dramatically better 2008 than the index.
The third lesson is about behavior at the bottom. Anyone steadily buying through 2008 and 2009, in the spirit of dollar-cost averaging, purchased shares at prices that looked absurd within four years; anyone who sold in March 2009 locked in the full 57 percent loss.
There is also a lesson in what correlations did. During the panic phase nearly every stock fell together, so diversification across dozens of names protected little in the moment; what mattered was the quality of each business and the absence of borrowed money against the portfolio.
Run the numbers on your own holdings before the next decline, not during it. Write down what each position earns in cash, what it owes, and what you would do at half the price: investors who had those answers ready in 2007 were able to be buyers in 2009, and that difference compounded for a decade.
None of this predicts the next crash, and past performance guarantees nothing about future results. But the numbers above are a calibration tool: when someone tells you a 50 percent decline is impossible, or that you will calmly buy through one, 2008 is the test both claims have to pass. The dot-com collapse offers a second, very different test: slower, deeper for growth stocks, and driven by valuation rather than credit.
Frequently asked questions
How much did the stock market drop in 2008?
Measured peak to trough, the S&P 500 fell almost 57 percent, from about 1,565 in October 2007 to 676.5 in March 2009. The steepest losses came between September 2008 and March 2009, after Lehman Brothers failed.
How long did the 2008 crash last?
The market decline ran about 17 months, from October 2007 to March 2009. The recession itself, as dated by the NBER, lasted 18 months, from December 2007 to June 2009, the longest US contraction since World War II.
How long did it take the market to recover after 2008?
The S&P 500 needed about four years from its March 2009 bottom to climb back to the October 2007 level, finally reclaiming it in early 2013. An investor who kept buying through the decline broke even much earlier because new shares were purchased at depressed prices.
What caused the 2008 stock market crash?
A housing downturn exposed enormous losses on mortgage-linked securities held by banks with thin capital. When Lehman Brothers failed in September 2008, credit froze, forced selling spread across markets, and equity prices repriced for a deep recession.
Educational content only, not investment advice. Data extracted on 2026-08-30. See our methodology and disclaimer.
Sources: www.nber.org · www.federalreserve.gov · www.federalreserve.gov · home.treasury.gov