Stock-Based Compensation: The Cost Hiding in Plain Sight
Most expenses reduce the profit numbers investors watch. Stock-based compensation manages a strange trick: it is a real cost, it is recorded as an expense, and yet the most popular cash flow metrics quietly add it back.
For a stock picker, that add-back matters. A company can look like a cash machine on paper while handing a large slice of that supposed cash to employees in newly created shares.
What stock-based compensation is
Stock-based compensation, usually shortened to SBC, is pay delivered as restricted stock units or options instead of salary. US accounting rules treat it as an operating expense, so it reduces reported net income like any other cost of running the business.
The twist sits one statement over. Because no cash leaves the company when shares are granted, the full SBC amount is added back to operating cash flow in the cash flow statement.
That add-back flows straight into free cash flow. The result is a metric prized for its honesty carrying a built-in blind spot.
The free cash flow illusion
Free cash flow is operating cash flow minus capital expenditures, a calculation walked through in our plain-English guide to free cash flow. Nothing in that formula removes SBC, because the cash flow statement already put it back.
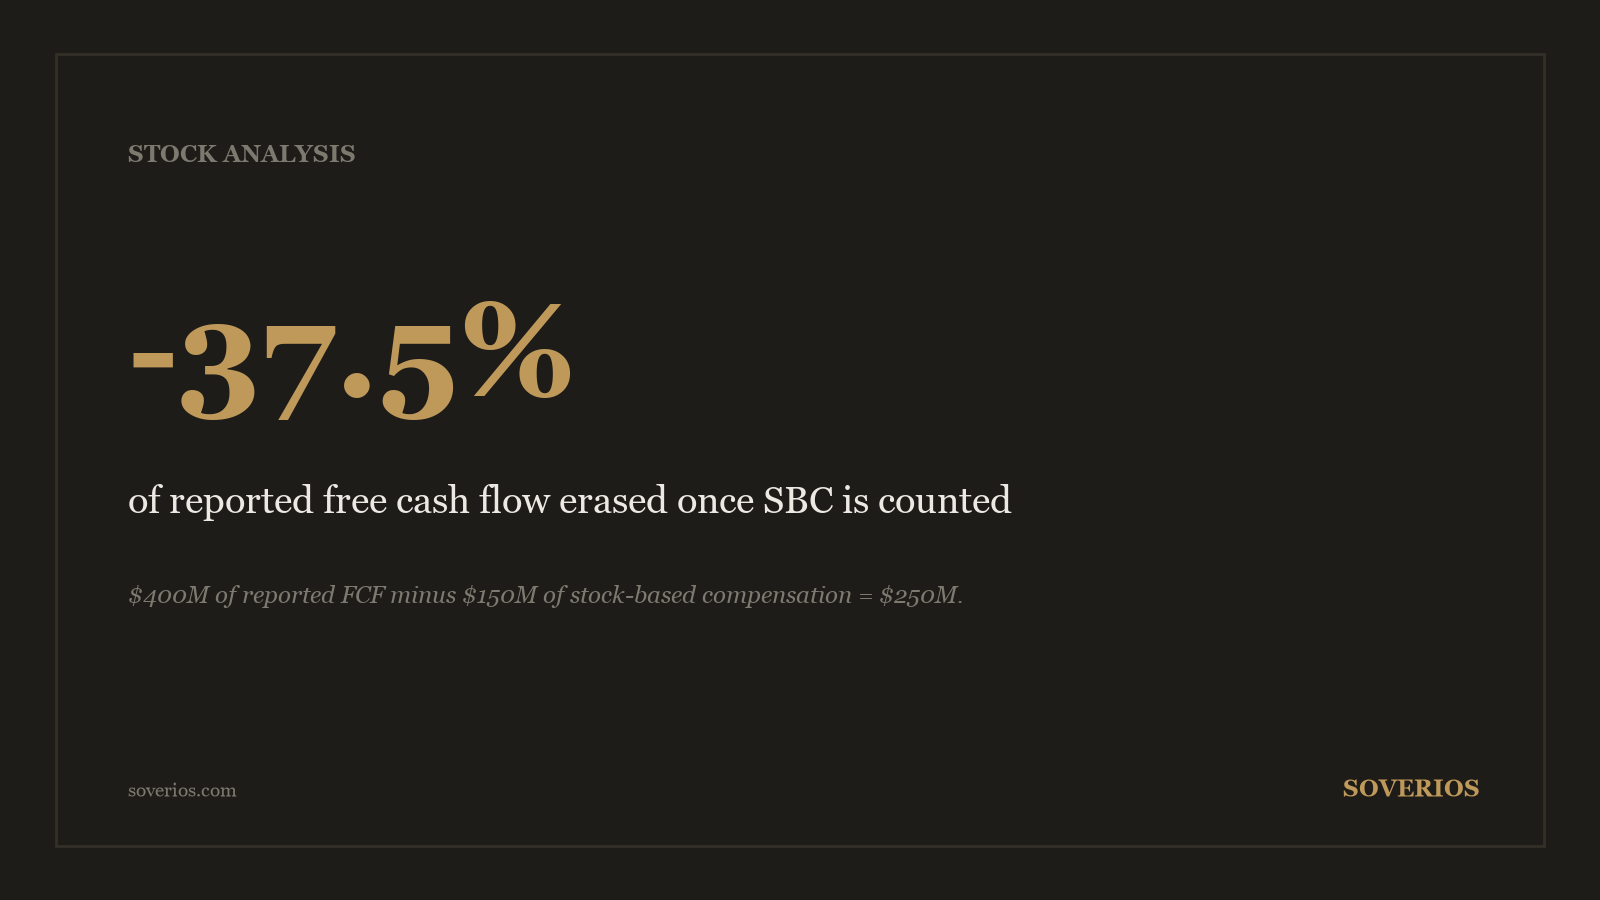
Take a hypothetical company reporting $500 million of operating cash flow, a figure that includes a $150 million SBC add-back. After $100 million of capital expenditures, it reports $400 million of free cash flow.
Now treat SBC as the compensation cost it is. The adjusted figure falls to $250 million, which is 37.5 percent below the headline number.
| Line | Amount |
|---|---|
| Operating cash flow | $500M |
| Capital expenditures | -$100M |
| Reported free cash flow | $400M |
| Stock-based compensation (added back above) | $150M |
| SBC-adjusted free cash flow | $250M |
A drop of that size changes valuations, not just footnotes. A stock that looked reasonably priced on free cash flow yield can turn expensive the moment you run the adjustment.
Put a market value on the same company to see the swing. At a $10 billion valuation, the reported figures show a 4 percent free cash flow yield, while the adjusted figures show 2.5 percent, and that difference is often the whole margin between a buy and a pass.
Why “non-cash” is the wrong frame
Defenders of the add-back lean on the phrase “non-cash expense,” and the phrase deserves scrutiny. The company avoided a cash payment only by giving away pieces of itself instead.
Run the thought experiment. If the same company had paid the $150 million in salaries and then sold $150 million of new shares to the market, the cash effects would net out to roughly the same place, yet nobody would call the salaries fake.
Depreciation, the other famous non-cash charge, at least refers to cash spent in the past. SBC refers to shareholder value handed out in the present, which makes it the one add-back that directly transfers your ownership to someone else.
Dilution: how shareholders pay the bill
The shares granted to employees do not appear from nowhere. Every new share shaves down the ownership percentage of everyone already holding the stock, a process known as dilution.
Suppose a hypothetical company has 200 million shares outstanding and issues a net 2 percent more each year through its compensation plans. The arithmetic compounds against you quietly.
| Year | Shares outstanding | Ownership of a 2M-share stake |
|---|---|---|
| 0 | 200.0M | 1.00% |
| 5 | 220.8M | 0.91% |
| 10 | 243.8M | 0.82% |
After a decade, your unchanged 2 million shares represent 0.82 percent of the company instead of 1.00 percent. You lost roughly 18 percent of your claim on every future dividend and every dollar of earnings without selling a single share.
Growth in earnings per share absorbs the same tax. If net income compounds at 8 percent a year while the share count grows 2 percent, EPS only compounds at about 5.9 percent.
Buybacks that hide the bill
Many companies respond to dilution with share repurchases, and the combination deserves close reading. A share buyback only returns capital when it actually reduces the share count.
Picture a company spending $300 million a year on repurchases while its share count stays flat. Those buybacks are not rewarding shareholders: they are absorbing the shares issued to employees, which makes the $300 million a compensation cost settled in cash, one step removed.
The test takes thirty seconds. Compare the diluted share count today against five years ago, and if it has not fallen despite years of headline buybacks, the repurchase program has been running on a treadmill.
Where SBC bites hardest
SBC tends to be largest, relative to the size of the business, at younger technology companies that pay scarce engineers with equity. At that stage it can rival or exceed reported operating income, so ignoring it means valuing a fictional company.
The trend matters as much as the level. SBC growing faster than revenue for several years running means the cost of keeping the team is outpacing the business itself, a pattern that belongs on any list of red flags in financial statements.
Placement in the accounts adds one more trap. The income statement spreads SBC across cost of revenue, research, and administrative lines, so the visible total lives in the cash flow statement and the footnotes, both covered in our guide to reading a 10-K efficiently.
How to adjust for SBC in practice
The fix does not require forensic accounting. Four steps cover it.
- Find the SBC add-back in the operating section of the cash flow statement.
- Subtract it from reported free cash flow before valuing the company, treating it like the cash cost it replaces.
- Pull the diluted share count for the past five years and compute the annual growth rate.
- Net any buybacks against shares issued: only the reduction in total count is capital returned to you.
Run the numbers both ways and let the gap tell the story. A company showing $400 million of reported free cash flow but $250 million adjusted, with a share count creeping up 2 percent a year, is a different investment than its headlines suggest.
The size of that gap also works as a comparison tool across companies. Between two businesses with identical reported free cash flow, the one whose adjusted figure holds up is simply cheaper, whatever the screeners say.
One warning on timing: SBC granted today converts into shares over several years, so the dilution you measure now reflects decisions made earlier. A company that recently doubled its grants will show the share count damage later, which is one more reason to read the compensation footnote and not just last year’s count.
None of this makes SBC-heavy companies uninvestable, since equity pay can fund genuine growth that cash salaries could not. It simply belongs inside the same discipline as every other step in our framework for analyzing a stock: price the business you actually own, not the one in the press release.
Frequently asked questions
Is stock-based compensation a real expense?
Yes. Employees accept shares in place of salary, so shareholders pay the bill through dilution instead of cash. US accounting rules require companies to record SBC as an operating expense against net income for exactly that reason.
Why is SBC added back to operating cash flow?
Because no cash leaves the company when shares are granted, the cash flow statement reverses the expense in the operating section. The mechanics are correct for tracking cash, but they make free cash flow look richer than what shareholders truly keep.
Should I subtract SBC from free cash flow?
For valuation purposes, yes. Treating SBC as if it were a cash cost gives a more honest picture of the cash available to shareholders, since the company would otherwise have to pay equivalent salaries in cash or buy back the issued shares.
Where do I find a company's SBC figure?
The cleanest single number sits in the operating section of the cash flow statement, listed as an add-back to net income. The footnotes break down the same total by type of award and by income statement line.
Educational content only, not investment advice. See our methodology and disclaimer.