Tracking Difference: The Index Fund Fee You Never See
An index is a spreadsheet: it pays no fees, executes no trades, and holds no cash. Your index fund does all three, and the difference shows up as a return gap that no marketing page advertises.
That gap is the tracking difference, and it is the true price of owning the fund. The expense ratio you see on the label is only one of its ingredients.
The good news: tracking difference is public information, sitting in plain sight in every fund’s own performance table. You just have to do one subtraction most investors never do.
What tracking difference actually measures
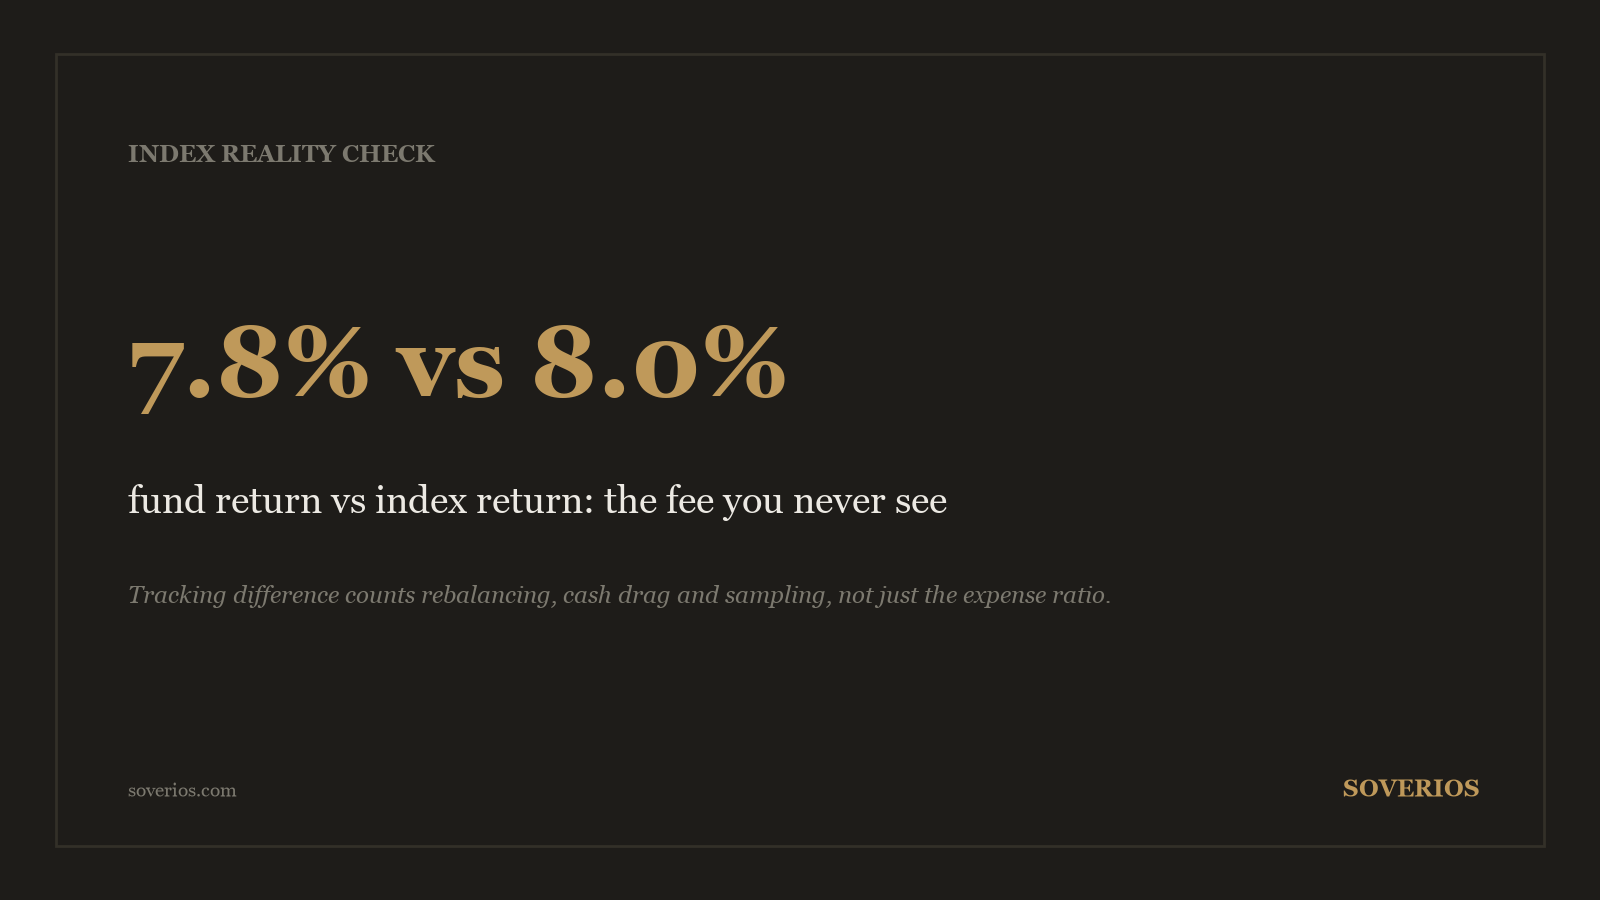
Tracking difference is the fund’s total return minus the index’s total return over the same period. If the index gains 8.0 percent in a year and the fund gains 7.8 percent, the tracking difference is -0.2 percent.
It answers the only question that matters about an index fund: how much of the index’s return did I actually receive? A related metric, tracking error, answers a different question: how consistent is the gap from period to period.
| Metric | What it measures | What it tells you |
|---|---|---|
| Tracking difference | Fund return minus index return | The real cost of owning the fund |
| Tracking error | Volatility of that gap over time | How predictable the fund’s behavior is |
Fund documents often headline tracking error because a low number looks reassuring. A fund can hug its index with beautiful consistency while lagging it by the same amount every single year.
Where the return gap comes from
The expense ratio is the first and most visible ingredient: a 0.10 percent fee mechanically removes 0.10 percent of return. The rest of the gap comes from operational frictions that no label discloses.
Rebalancing is one. When the index adds or removes companies, every tracking fund must trade the same stocks around the same dates, and the market impact of that synchronized trading is paid by fund holders.
Cash drag is another. Funds hold small cash balances to handle flows and dividends awaiting reinvestment, and in a rising market that idle cash lags the index.
Some funds also sample rather than replicate, holding a representative subset of the index instead of every constituent. Sampling cuts trading costs but lets the portfolio drift from the benchmark in both directions.
One ingredient works in the investor’s favor. Funds lend portfolio securities to short sellers for a fee, and that lending income offsets part of the costs, occasionally pushing a fund slightly above its index.
| Source of the gap | Direction | Shows up in expense ratio? |
|---|---|---|
| Management fee | Negative | Yes |
| Rebalancing trades | Negative | No |
| Cash drag | Negative in rising markets | No |
| Sampling drift | Either | No |
| Securities lending | Positive | No |
What a small gap costs over 20 years
Small annual percentages become large dollar amounts once compounding runs long enough. Take a hypothetical $100,000 invested for 20 years while the index compounds at 8.0 percent per year: the index path alone grows to $466,096.
Now hold everything constant and apply three levels of annual tracking difference. The table shows the final values, each one recomputed from the lagged rate.
| Annual lag vs index | Effective return | Value after 20 years | Shortfall vs index |
|---|---|---|---|
| 0.05% | 7.95% | $461,799 | $4,297 |
| 0.25% | 7.75% | $444,985 | $21,111 |
| 0.50% | 7.50% | $424,785 | $41,311 |
A steady 0.25 percent lag, invisible on any fee label, costs this hypothetical investor $21,111, roughly a fifth of the original stake. At 0.50 percent, the shortfall passes $41,000.
Here is the uncomfortable comparison: a fund advertising a 0.03 percent expense ratio while lagging its index by 0.25 percent charges you about eight times its sticker price. The label is honest about the fee and silent about the rest.
How to measure it before you buy
Open the fund’s fact sheet or annual report and find the performance table: providers must show the fund’s returns next to the benchmark’s over 1, 5, and 10 years. Subtract the index return from the fund return at each horizon.
Use NAV total returns, not market price returns, for this exercise. For an ETF, the market price adds a separate layer of premiums, discounts, and bid-ask spreads that belongs to your trading costs, not to the fund’s tracking quality.
Prefer the 5-year and 10-year gaps over any single year. One year of data mixes noise, timing effects, and luck; a decade of steady lag is a verdict.
A worked example makes the subtraction concrete. A hypothetical fund reports a 10-year annualized return of 11.90 percent while its benchmark shows 12.15 percent: the tracking difference is -0.25 percent per year, and that figure, not the 0.04 percent fee on the label, is what the fund cost its holders.
One trap to avoid: make sure the benchmark you subtract is the total return version of the index, the one that includes reinvested dividends. Comparing a fund’s total return against a price-only index makes the fund look better than it is by several points over a decade.
Which funds track tightly and which do not
Not all indexes are equally easy to follow, so expectations should vary by category. A large-cap US index built from the most liquid stocks in the world can be replicated almost perfectly, and the best funds tracking it show gaps close to their expense ratio.
The job gets harder as the underlying market gets thinner. Small-cap indexes, bond indexes, and anything with illiquid constituents force funds into more sampling and costlier trades, which widens the expected gap.
That gives you a simple standard when comparing funds on the same index. The index costs are identical for everyone, so a fund that lags its rivals by 0.15 percent per year on the same benchmark is simply executing worse, and ten years of data will show it.
What this means for a stock picker
Tracking difference is a fair entry in the ledger this pillar keeps on passive investing, alongside the concentration and constraints covered in the index reality check. The sticker fee understates the cost of indexing, and the honest cost only appears when you compute it, the same way expense ratios compound over 20 years into sums the percentages hide.
Owning stocks directly removes both layers: there is no expense ratio and no tracking gap on shares you hold yourself. That saving is real, and it is one of the quieter arguments in the case for picking stocks.
It is not a free lunch. A direct portfolio pays its own frictions in spreads and occasional trades, and above all it returns whatever your selections earn, for better or worse.
The actionable rule works for everyone, indexer or picker. Never buy an index fund on its expense ratio alone: compute the 5-year and 10-year tracking difference first, and treat that number, not the label, as the price of admission.
Frequently asked questions
What is the difference between tracking difference and tracking error?
Tracking difference is the size of the return gap between fund and index over a period, and it is what costs you money. Tracking error is the volatility of that gap over time, a consistency measure. A fund can have low tracking error and still lag steadily.
Why does my index fund return less than the index?
The index is a calculation with no costs. The fund pays management fees, trades to follow index changes, holds small cash balances, and sometimes samples instead of full replication. Each effect shaves return, which is why the fund lags the paper index.
Can a fund's tracking difference be positive?
Yes, occasionally. Securities lending income and favorable trading around index changes can offset costs, letting a fund land slightly above its index in a given year. A persistent positive gap is rare and worth investigating rather than celebrating.
Where do I find the numbers to compute tracking difference?
Fund providers publish annualized NAV total returns next to the benchmark's total return in fact sheets, prospectuses, and annual reports. Subtract the index figure from the fund figure over 5 and 10 years for the cleanest read.
Educational content only, not investment advice. See our methodology and disclaimer.
Sources: www.investor.gov · www.investor.gov · www.investor.gov