The Dot-Com Bubble in Numbers
On March 10, 2000, the Nasdaq Composite closed at 5,048.62, its all-time high. Thirty-one months later it traded near 1,114, a decline of almost 78 percent and a return to the exact level it had first reached in August 1996.
No major US index in the modern era has combined that depth with that duration of recovery. The Nasdaq did not close above 5,000 again until March 2015, fifteen years after the peak.
This study lays out the bubble in verified numbers: the inflation, the collapse, the recovery math, and the valuation lessons that still apply to every growth stock pitch you will hear this year.
How big the bubble got
The bubble was not a decade-long affair. Research by DeLong and Magin published through the NBER finds little sign that the aggregate US stock market was in a significant bubble until about 1998.
The final phase was the violent one. The Nasdaq roughly doubled in the twelve months before its March 2000 peak, a pace that priced in flawless execution from hundreds of companies at once.
The fuel was a flood of stock offerings. Hundreds of technology companies completed an IPO in 1999 and 2000, many with no earnings and some with barely any revenue, and first-day price jumps became the norm rather than the exception.
Valuation discipline inverted. Because most dot-coms had no earnings to which a P/E ratio could be applied, analysts reached for revenue multiples, then for metrics like page views that had no direct connection to cash at all.
Compensation practices quietly deepened the problem. Many companies paid staff heavily in options, so existing shareholders faced constant dilution, a cost that reported earnings understated then and that stock-based compensation still obscures today.
The math the peak prices required
To see why the top prices could not survive contact with arithmetic, work through a hypothetical company priced the way the era priced its favorites. Suppose it trades at a $30 billion market value on $1 billion of revenue, a multiple of 30 times sales.
Now hand it a spectacular decade: revenue quadruples to $4 billion and the business earns a strong 15 percent net margin, or $600 million of net income. At a healthy 20 times earnings, the company is then worth $12 billion, which is 60 percent below the price paid ten years earlier.
| Hypothetical company | Value |
|---|---|
| Market value at purchase | $30 billion (30x sales) |
| Revenue after a decade of 4x growth | $4 billion |
| Net income at a 15% margin | $600 million |
| Worth at 20x earnings | $12 billion (60% below cost) |
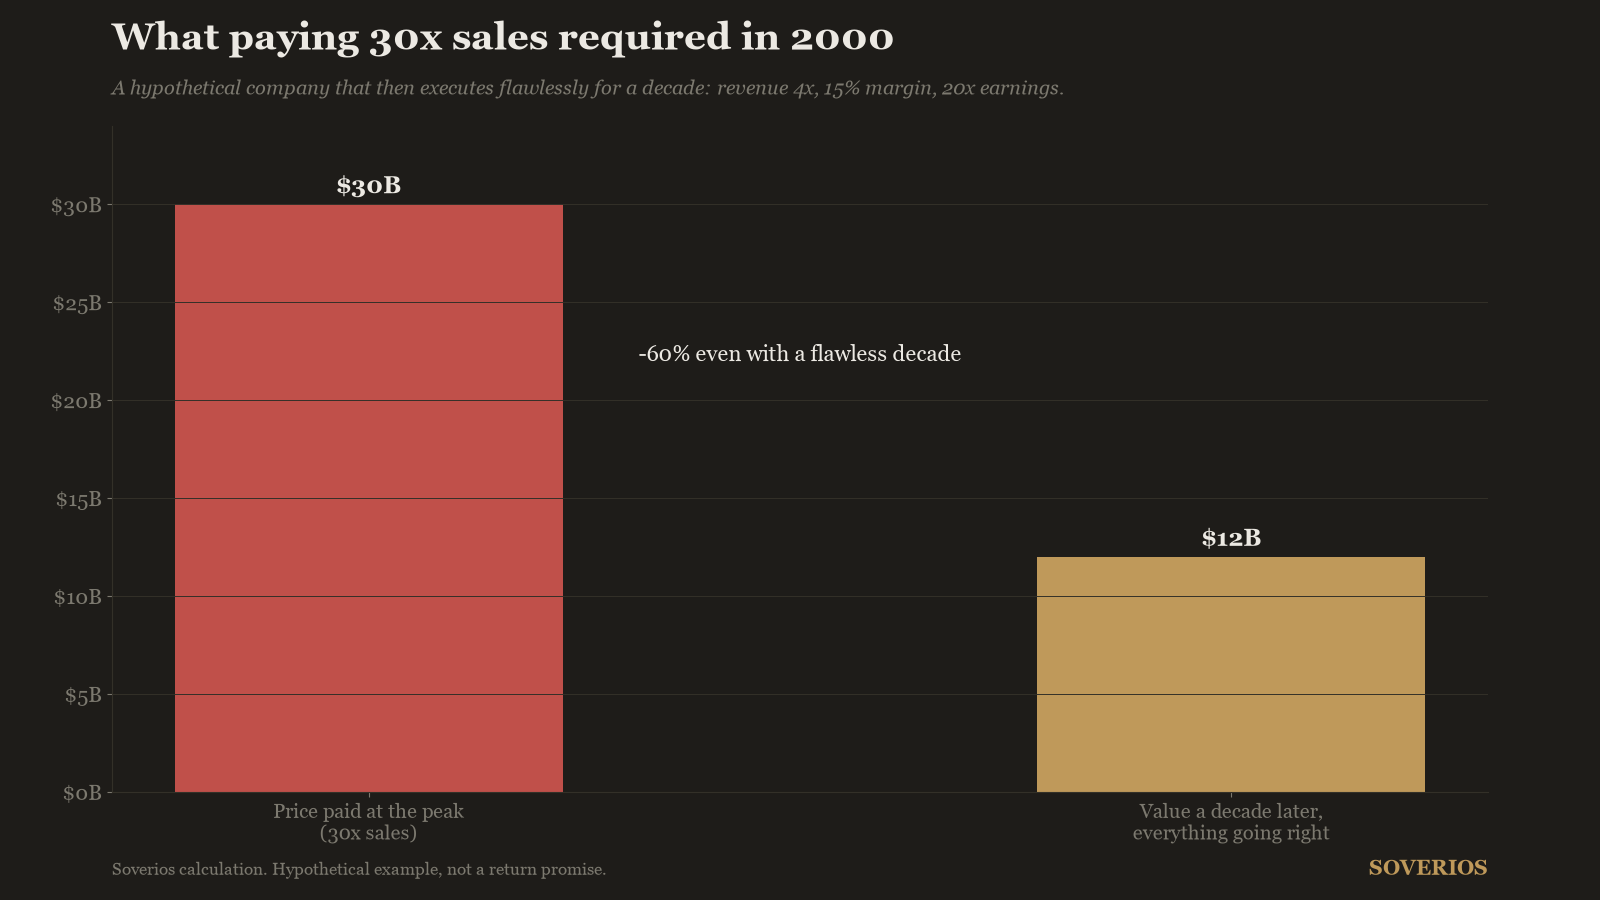
That is the trap in one table: flawless operations, catastrophic investment. Hundreds of March 2000 valuations embedded assumptions even more aggressive than these.
The collapse, month by month
The decline began quietly, three days after the peak, and never found a durable floor for two and a half years. Rallies of 20 percent and more punctuated the fall, each one drawing in buyers convinced the bottom had passed.
Those failed rallies made averaging down ruinous. A hypothetical buyer who waited until the index had already been cut in half, entering near 2,500, still lost more than 55 percent from that entry before the October 2002 bottom.
The table below anchors the key dates, each verified against Federal Reserve and NBER records.
| Date | Event |
|---|---|
| March 10, 2000 | Nasdaq Composite closes at its peak of 5,048.62 |
| May 16, 2000 | Fed raises its target rate 50 basis points to 6.5 percent |
| March 2001 | Recession begins (NBER dating) |
| November 2001 | Recession ends after 8 months |
| October 2002 | Nasdaq bottoms near 1,114, down almost 78 percent |
| June 25, 2003 | Fed funds target reaches 1.0 percent |
| March 2015 | Nasdaq closes above 5,000 for the first time since 2000 |
The broader market suffered too, though less severely. The S&P 500 lost close to half its value between its 2000 peak and the October 2002 low, and 2002 alone brought a decline of 22.1 percent, the index’s worst calendar year since 1974.
That made 2000 through 2002 the first stretch of three consecutive losing years for the index since 1939 to 1941. The bear market was grinding rather than sudden, the opposite profile of 2008.
The recovery math
A 78 percent drawdown is not four times worse than a 20 percent one. It is categorically different, because the gain required to recover grows exponentially as losses deepen.
An investor holding a hypothetical $100,000 Nasdaq index position at the peak held about $22,000 at the trough. Getting back to $100,000 required multiplying the remaining capital by roughly 4.5, a gain of about 353 percent.
| Drawdown | Gain needed to break even |
|---|---|
| -20% | +25% |
| -50% | +100% |
| -78% (Nasdaq 2000-2002) | +353% |
The index delivered that gain, but it took until March 2015. Fifteen years is longer than the time horizon many investors assume for their entire equity allocation, and the break-even is nominal: adjusted for inflation, the round trip stretched years further.
There is a hidden distortion in even that grim number: survivorship bias. The index recovered partly because failed companies were removed along the way; a portfolio frozen with the actual dot-com names of March 2000 would have fared far worse than the index arithmetic suggests.
The macro backdrop: a mild recession, a brutal market
The strangest fact about the dot-com bust is how little the real economy suffered. The NBER dates the recession from March 2001 to November 2001, just 8 months, one of the shortest contractions on record.
Monetary policy traced the whole arc. The Federal Reserve raised its target to 6.5 percent on May 16, 2000, near the market top, then cut relentlessly until the target reached 1.0 percent in June 2003.
| Date | Fed funds target |
|---|---|
| May 16, 2000 | 6.5% |
| June 25, 2003 | 1.0% |
Cheap money cushioned households and shortened the contraction, but it could not restore the prior prices. The market that eventually rebuilt was led by companies with real earnings, while most of the pure concept stocks of 1999 never traded near their highs again.
The lesson in that contrast: the equity losses were not payment for economic collapse. They were payment for prior overvaluation, a repricing that no rate cut could cancel, and rate cuts arrived for three straight years while the index kept falling. The 2008 episode inverted the pattern, with a credit-driven economic disaster and a somewhat smaller index decline, as our study of the 2008 crash details.
What the dot-com bust teaches the stock picker
The first lesson is that price always matters, even when the technology wins. The internet delivered on essentially every promise made in 1999, yet investors who paid March 2000 prices waited fifteen years to break even, because a great business bought at any price-to-sales multiple is not automatically a great investment.
The second lesson is that cash generation separates survivors from casualties. Companies that funded themselves from operations lived to compound through the bust, which is why a metric like free cash flow sits at the center of any serious analysis framework.
The third lesson is that indexes hide the bodies. The Nasdaq’s eventual recovery is real, but it is the recovery of a constantly rebuilt list, not of the stocks people actually owned in 2000.
The pattern also has a modern echo. A handful of giant technology companies once again carry an outsized share of index weightings, a setup we examine in the hidden concentration of the S&P 500, and the dot-com record is the cleanest historical test of what happens when leadership priced for perfection stumbles.
The practical takeaway is a stress test you can run today. For any growth stock in your portfolio, write down the gain built into its current multiple, then check it against the historical record of bear markets: if the position falling 78 percent and staying down for a decade would break your plan, the position, not the market, is the problem. Past performance does not guarantee future results, and that cuts both ways: neither the 2015 recovery nor the 2000 collapse is a forecast.
Frequently asked questions
How much did the Nasdaq fall in the dot-com crash?
The Nasdaq Composite fell almost 78 percent, from a closing peak of 5,048.62 on March 10, 2000 to about 1,114 in October 2002. It was one of the deepest declines ever recorded by a major US index.
How long did it take the Nasdaq to recover from the dot-com bubble?
About fifteen years. The Nasdaq Composite did not close above the 5,000 mark again until March 2015. Investors who bought near the March 2000 top waited a decade and a half just to break even, before counting inflation.
What caused the dot-com bubble to burst?
There was no single trigger. Rising interest rates, with the Fed's target reaching 6.5 percent in May 2000, collided with internet companies burning cash faster than they could raise it. Once new financing dried up, business models with no earnings failed in waves.
Did the dot-com crash cause a recession?
A mild one. The NBER dates the recession from March 2001 to November 2001, only 8 months. The contrast between a shallow recession and a devastating equity bear market shows that valuation, not the economy, drove the losses.
Educational content only, not investment advice. Data extracted on 2026-08-30. See our methodology and disclaimer.
Sources: www.nber.org · www.federalreserve.gov · www.federalreserve.gov · www.nber.org