High Yield Traps: How to Spot a Dividend About to Be Cut
A 9 percent yield on a screen looks like a gift. More often it is a warning printed in large type, because yields that high usually come from a falling price, not a rising dividend.
That situation has a name: a dividend trap. The yield that attracted you is frequently the next casualty, and the cut takes another slice of the share price with it.
This article gives you the detection checklist: six signals you can verify in under an hour with public filings. It goes deeper than the definition, into the payout math that decides whether a dividend survives.
Why an unusually high yield is a warning
Dividend yield is a fraction: annual dividend divided by share price. Nothing about a high yield says the dividend is safe, because the denominator does most of the moving.
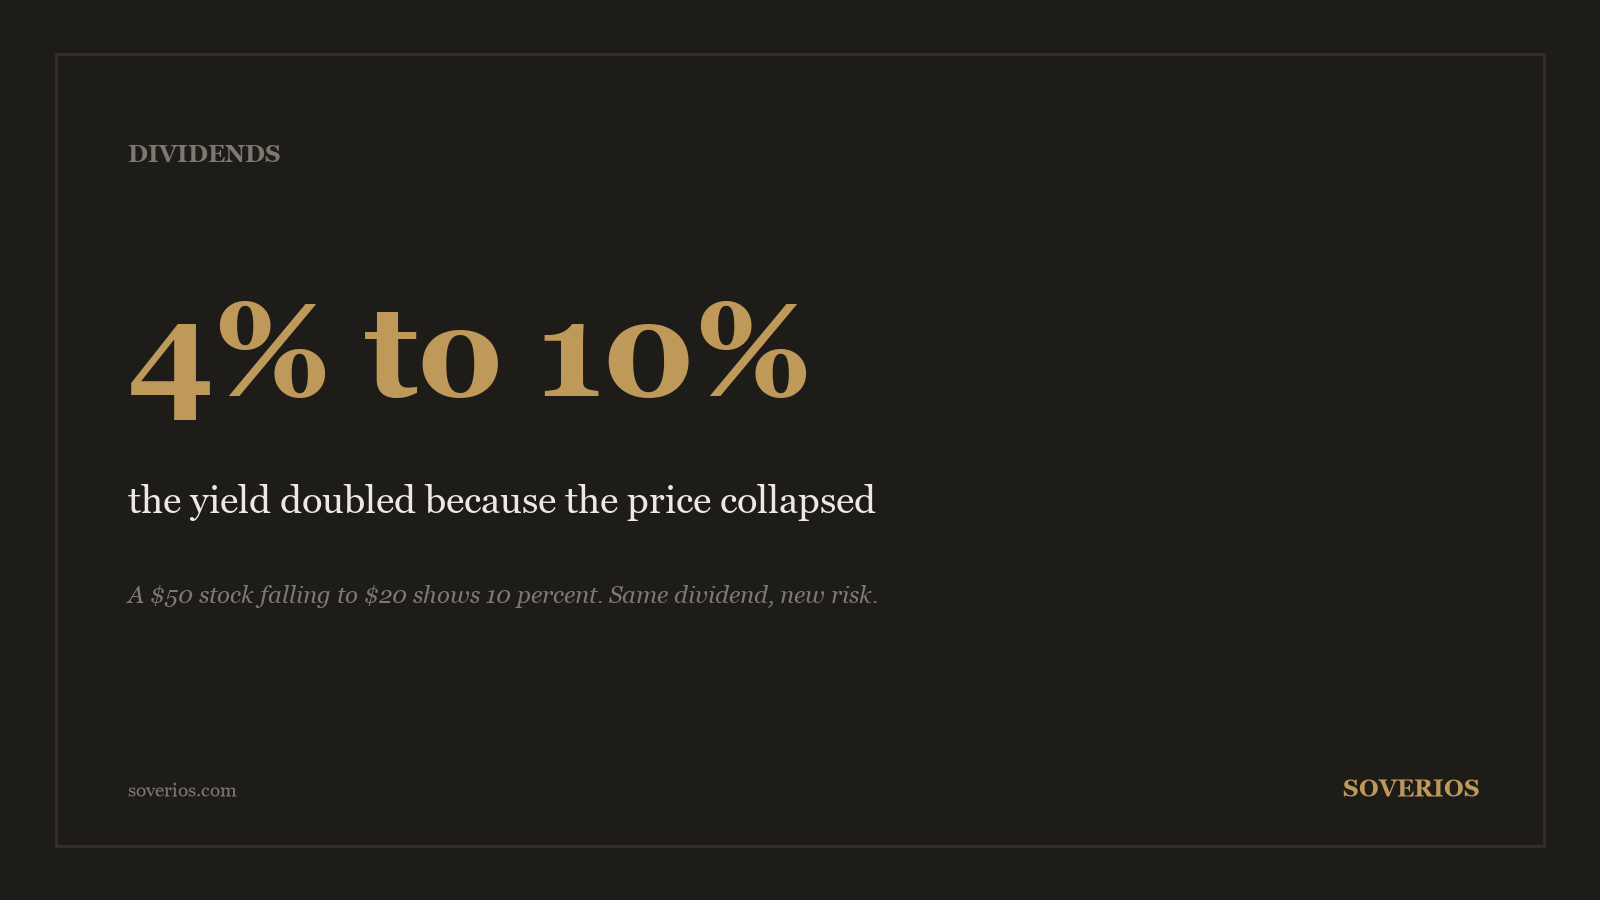
Take a hypothetical stock paying $2.00 per share while trading at $50. Its yield is 4 percent, unremarkable for an income stock.
Now the business stumbles and the price drops to $20. The dividend has not changed, but the yield reads 10 percent.
| Situation | Share price | Annual dividend | Yield |
|---|---|---|---|
| Before the decline | $50 | $2.00 | 4.0% |
| After the decline | $20 | $2.00 | 10.0% |
The screen shows a 10 percent yielder. What actually happened is that sellers marked the business down 60 percent, and the market is pricing in a real chance that the $2.00 does not survive.
There is a second mechanical problem: most screeners display trailing yield, built from dividends already paid. A company can announce a cut on Monday and still show its old, fat yield on screens for weeks.
So the number that lured you in can describe a payout that no longer exists. Always check the most recent declared dividend, not the trailing twelve months.
The six signals of a dividend about to be cut
No single signal is proof. Two or more together, and the yield stops being income and starts being a bet.
1. Earnings payout ratio above 80 percent
The payout ratio is dividends divided by net income. Suppose a company earns $3.00 per share and pays $2.70: that is a 90 percent payout, so a 10 percent earnings dip pushes the dividend above what the company earns.
History of the metric is covered in our piece on why payout ratio predicts dividend cuts. The short version: the higher the ratio, the smaller the margin for error.
2. Dividend larger than free cash flow
Earnings are an accounting opinion; free cash flow is the cash left after operations and capital spending. Keep the same company: it pays $2.70 per share but generates only $2.00 of free cash flow per share, so the dividend consumes 135 percent of the cash the business produces.
| Per-share figure | Amount | Dividend as % of it |
|---|---|---|
| Net income | $3.00 | 90% |
| Free cash flow | $2.00 | 135% |
The missing $0.70 per share has to come from somewhere: new debt, asset sales, or drawn-down reserves. If you need a refresher on the metric itself, start with what free cash flow is and how to pull it from the cash flow statement.
3. Debt rising to cover the payout
A financed dividend leaves fingerprints on the balance sheet. Watch net debt climbing year after year while the dividend holds steady and free cash flow shrinks.
The pressure gauge is the interest coverage ratio: operating income divided by interest expense. When coverage slides toward 2x, the bondholders’ claim starts crowding out the shareholders’ dividend, and bondholders get paid first.
4. Revenue and earnings in decline
A dividend is only as durable as the business behind it. Three straight years of falling revenue mean the payout is being defended, not grown.
Declining fundamentals rarely travel alone. Our guide to red flags in financial statements covers the accounting symptoms that often accompany a dividend under siege.
5. A yield towering over sector peers
Every sector has a normal range. If the sector median yields 3 percent and one stock offers 9 percent, the market is not being generous with you specifically.
Markets misprice individual stocks, but rarely by a factor of three on a metric this visible. The burden of proof sits on the outlier.
6. A freeze after years of raises
Boards telegraph distress. A company that raised its dividend for a decade and then holds it flat for two years is conserving cash while trying not to say so.
A freeze is often the last stop before a cut. Treat it as a change of policy, not a pause.
The checklist in one table
Run these six checks against the latest annual filing before buying any yield above its sector norm.
| Signal | Danger zone | Where to check |
|---|---|---|
| Earnings payout ratio | Above 80% | Income statement + dividends paid |
| Dividend vs free cash flow | Above 100% of FCF | Cash flow statement |
| Net debt trend | Rising 3+ years | Balance sheet |
| Revenue trend | Falling 2-3 years | Income statement |
| Yield vs sector median | More than double | Any screener |
| Dividend history | Frozen after raises | Dividend record |
What a trap costs when it springs
Numbers make the risk concrete. Suppose you put $10,000 into that hypothetical $20 stock: 500 shares, promising $2.00 each, or $1,000 of annual income.
Two quarters later the board cuts the dividend 60 percent, to $0.80 per share. Your income drops to $400, and the stock, already cheap, falls to $14 as income funds sell.
| Metric | At purchase | After the cut |
|---|---|---|
| Share price | $20 | $14 |
| Annual income (500 shares) | $1,000 | $400 |
| Position value | $10,000 | $7,000 |
You reached for a 10 percent yield and got a 4 percent one on a position worth $7,000. The $3,000 capital loss equals seven and a half years of the income that remains.
Run the comparison against the boring alternative. A safe payer yielding 3 percent on the same $10,000 would have delivered $300 a year with the principal intact, and it would take the trap survivor decades of $400 checks just to claw back the capital gap.
The asymmetry is the whole lesson. The extra $700 of promised income was real for two quarters; the $3,000 loss is real for as long as you hold.
The stock picker’s move: buy the payer, not the payout
The way out of trap territory is to invert the shopping order. Screen for businesses first, then accept whatever yield a durable payer offers, even if it is a modest one.
That usually points toward moderate yields with growing dividends rather than extreme yields with shrinking coverage. The trade-off is quantified in our comparison of dividend yield versus dividend growth, and companies with decades of uninterrupted raises get a full examination in whether Dividend Aristocrats are worth it.
Before any purchase, run the six-signal table above against the latest 10-K. For where dividends fit in a complete stock picking approach, the dividend investing guide maps the whole territory.
Frequently asked questions
Is a high dividend yield always a bad sign?
No. Some sectors, like utilities or energy pipelines, structurally pay more. The warning sign is a yield far above the company's own history and its sector peers. That gap usually means the market expects a cut and has already priced part of it in.
What payout ratio is safe for a dividend?
There is no universal number, but a payout ratio below 60 percent of earnings leaves room for a bad year. Above 80 percent, one weak stretch can force a cut. Cyclical businesses need lower ratios than stable ones because their earnings swing harder.
Why does the stock price fall when a dividend is cut, if the cut was expected?
A cut confirms the worst reading of the numbers and forces income funds that must hold dividend payers to sell. It also signals that management sees the pressure lasting. The confirmation and the forced selling usually push the price below where it traded on rumor alone.
Can a company pay a dividend it does not earn?
Yes, for a while. It can borrow, sell assets, or issue shares to fund the payout. That is exactly the situation the free cash flow test catches: a dividend above 100 percent of free cash flow is being financed, not earned, and financing has a limit.
Educational content only, not investment advice. See our methodology and disclaimer.
Sources: www.investor.gov · www.investor.gov