Dividend Investing: The Stock Picker's Guide
A dividend is a portion of a company’s profit paid to shareholders, usually every quarter in the US. That definition, straight from the SEC’s investor education site, hides the real question: which companies can keep paying, and which are about to stop?
Dividend investing as a stock picker means answering that question yourself, company by company. This guide walks through the full framework: the mechanics, the yield versus growth decision, the safety checks, the traps, and what US taxes take from the result.
How a dividend actually reaches you
The board declares a dividend, and from that moment four dates control who gets paid. You must own the stock before the ex-dividend date; buy on or after it and the seller keeps the payment.
The record date fixes the official shareholder list, and the payment date is when cash lands in your account. In practice you only need to watch the ex-dividend date: the others follow automatically.
One warning about that mechanic: the stock price typically drops by roughly the dividend amount on the ex-dividend date. Buying the day before the ex-date does not capture free money, it captures a taxable payment and an equivalent price drop.
Reading the yield correctly
The dividend yield is the annual dividend divided by the current share price. A hypothetical stock trading at $40 and paying $0.30 per quarter, or $1.20 per year, yields 3%.
The denominator is a live market price, which is what makes yield treacherous. If that stock falls to $20 while the dividend holds, the yield doubles to 6% without the company paying a cent more.
A rising yield can therefore mean two opposite things: a raised payment or a punished stock. Always check which one moved before reacting to the number.
Two refinements keep the figure honest. Exclude any special dividend from the calculation, since one-off payments say nothing about next year, and remember that share buybacks return cash too, so two companies with identical yields can have very different total payouts.
Yield today or growth tomorrow
Every dividend stock sits somewhere on a spectrum between high current dividend yield and high dividend growth rate. A utility might pay 5% and raise it 2% a year, while a software company pays 1% and raises it 12%.
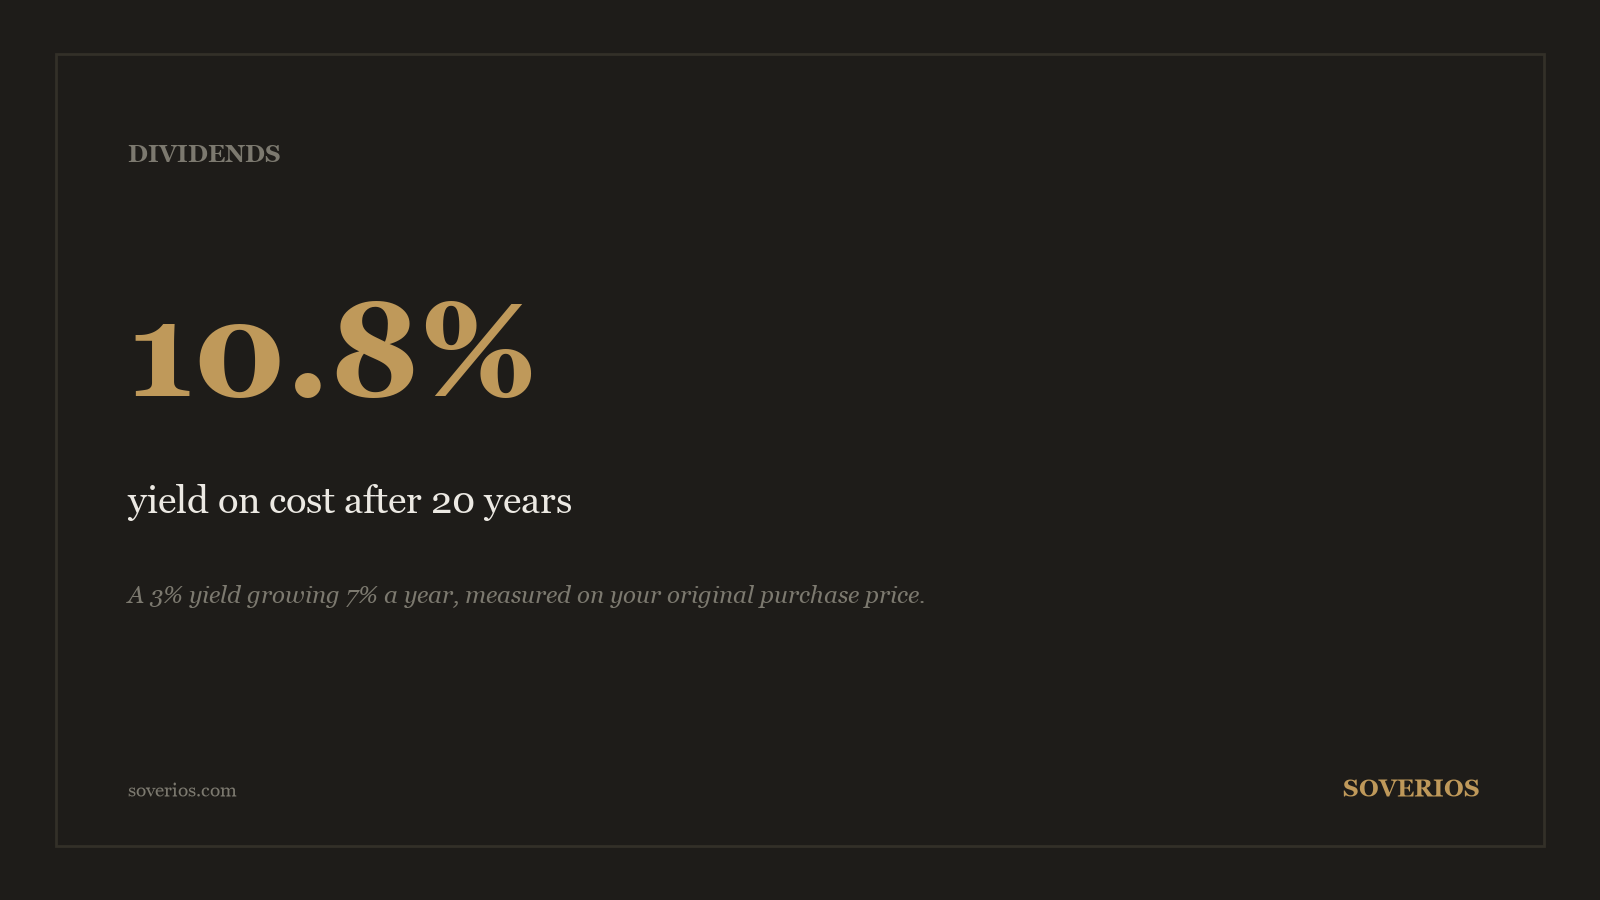
The trade-off is not obvious, because growth compounds against your original purchase price. Suppose a hypothetical stock bought for $10,000 yields 3% today, or $300 a year, and raises its dividend 7% annually.
The income keeps climbing against a cost that never moves. That ratio has a name: yield on cost.
| Year | Annual income | Yield on original $10,000 |
|---|---|---|
| 1 | $300 | 3.0% |
| 5 | $393 | 3.9% |
| 10 | $551 | 5.5% |
| 15 | $774 | 7.7% |
| 20 | $1,085 | 10.8% |
After 20 years the position pays 10.8% of what you invested, every year, without a single additional dollar. We run the full comparison, with a crossover table between a 6% yielder and a 2% fast grower, in the 20-year math of yield versus dividend growth.
The safety check that comes before everything else
Before yield, before growth, one number decides whether the dividend survives: the payout ratio. It is the share of earnings paid out as dividends, and a company distributing 95% of its profit has no cushion for a bad year.
Earnings can be shaped by accounting choices, so serious dividend investors check the payment against free cash flow too. A dividend covered by reported earnings but not by actual cash is a countdown, not an income stream.
The thresholds, the erosion pattern, and a worked example of a cut foretold two years in advance are in how the payout ratio predicts dividend cuts. If free cash flow is new territory, start with what free cash flow is and how to calculate it.
The trap that catches yield chasers
Sort any screener by yield and the top of the list will show 9%, 11%, 14%. Those numbers are almost never generosity: a yield spikes when a price collapses, and prices collapse when the market expects trouble.
A stock yielding 12% because its price fell 60% is the market voting that the dividend will not survive. Buying it means betting against everyone who sold, without their information.
This pattern is common enough to have a name, the dividend trap. The specific warning signs, from rising debt to a payout ratio above 100%, are cataloged in how to spot a dividend about to be cut.
Aristocrats: outsourcing the safety check
One shortcut exists: the Dividend Aristocrats, S&P 500 companies that have raised their dividend for at least 25 consecutive years. A 25-year raising streak filters out most fragile payers automatically, because surviving 2000, 2008, and 2020 while raising the dividend requires real cash generation.
The elite tier, Dividend Kings, extends the requirement to 50 years. But a long streak is a record, not a guarantee, and some Aristocrats trade at valuations that erase their appeal.
Whether the label is worth paying up for, and what the data shows about their returns, is the subject of are Dividend Aristocrats worth it.
What the dividend policy itself tells you
A board sets the dividend as a signal, and reading that signal is free analysis. A raise says management expects the next few years to fund it; a freeze says something inside the plan changed.
Streaks matter because breaking one is expensive. A company that has raised its dividend for 18 straight years knows a cut will crater its shareholder base, so it will usually trim buybacks, capital spending, even headcount first.
That defense has a dark side: it is exactly how payout ratios erode into the 90s while press releases stay confident. Treat a raising streak paired with a climbing payout ratio as a warning wrapped in reassurance.
Cadence carries information too. Most US payers raise once a year in the same quarter, so a skipped raise cycle is often the first public hint of a freeze, months before any announcement.
What US taxes take
For US taxpayers, dividends come in two flavors. Ordinary dividends are taxed at your regular income tax rate, while qualified dividends are taxed at the lower long-term capital gains rates.
Per the IRS, those capital gains rates are 0%, 15%, or 20% depending on your taxable income, and most dividends from US companies held beyond the required holding period qualify. The difference is material: on $10,000 of dividend income, a taxpayer in the 32% ordinary bracket paying the 15% qualified rate keeps $1,700 more.
| Treatment | Tax on $10,000 of dividends | Kept |
|---|---|---|
| Ordinary rate (32% bracket) | $3,200 | $6,800 |
| Qualified rate (15%) | $1,500 | $8,500 |
Holding dividend payers in a tax-advantaged account like an IRA defers or removes the drag entirely. Details on both dividend types are in IRS Topic 404, listed in the sources below.
Reinvestment: where the compounding lives
Taking dividends as cash gives you income. Reinvesting them buys more shares that themselves pay dividends, and that loop is where dividend strategies build wealth.
Most brokers automate this through a DRIP, a dividend reinvestment plan that converts each payment into shares, including fractions, at no commission. Over decades the reinvested shares often end up generating more income than the original position.
The arithmetic behind that claim is the same compound interest that drives all long-term equity returns. We work through it, with tables, in the compounding math every stock picker should know.
The stock picker’s dividend checklist
Everything above compresses into a sequence you can run on any candidate in about an hour. It is the dividend-specific slice of a broader discipline covered in how to analyze a stock.
- Compute the payout ratio against earnings, then against free cash flow. Both below 70%, or walk away.
- Check the dividend growth rate over the past 5 and 10 years. Flat dividends signal a business protecting cash.
- Look at the yield relative to the stock’s own history. A yield far above its 10-year average usually means a falling price, not a rising payment.
- Read the balance sheet for debt maturities. Interest payments outrank dividends every time.
- Decide your role for the position: current income, or income growth. The right stock differs completely between the two.
A dividend portfolio built this way holds maybe 15 to 25 names you have individually verified. That verification is the entire edge over buying a dividend ETF: the fund owns the future cutters too, and you do not have to.
Size the positions by income, not just by dollars. If a single cut would erase more than about 10% of your annual dividend stream, the position is too large no matter how safe its ratios look today.
Frequently asked questions
How much money do you need to start dividend investing?
There is no minimum. A $1,000 position in a stock yielding 3% pays $30 a year, and most US brokers now charge zero commission and allow fractional shares. What matters early is building the habit of checking payout safety, not the dollar amount.
Are dividend stocks better than index funds?
Neither is better by default. An index fund gives you the market's average yield with no selection. Picking dividend stocks lets you target higher income or faster dividend growth, but only works if you do the verification an index never requires.
Do dividends really matter if a company can buy back shares instead?
Buybacks and dividends both return cash, but dividends are paid to you directly and are harder to quietly cancel. Companies cut buybacks constantly without headlines. A dividend cut is public and punished, which disciplines management.
What is a good dividend yield?
For US large caps, sustainable yields usually sit between 2% and 5%. Above roughly 6%, statistically you are more often looking at a stressed stock price than a generous company, so the payout deserves extra scrutiny before you buy.
Educational content only, not investment advice. See our methodology and disclaimer.
Sources: www.investor.gov · www.irs.gov · www.irs.gov