Payout Ratio: The Number That Predicts Dividend Cuts
Companies almost never cut their dividend by surprise. The warning is printed in their own filings, sometimes for years, inside one ratio anyone can compute in thirty seconds.
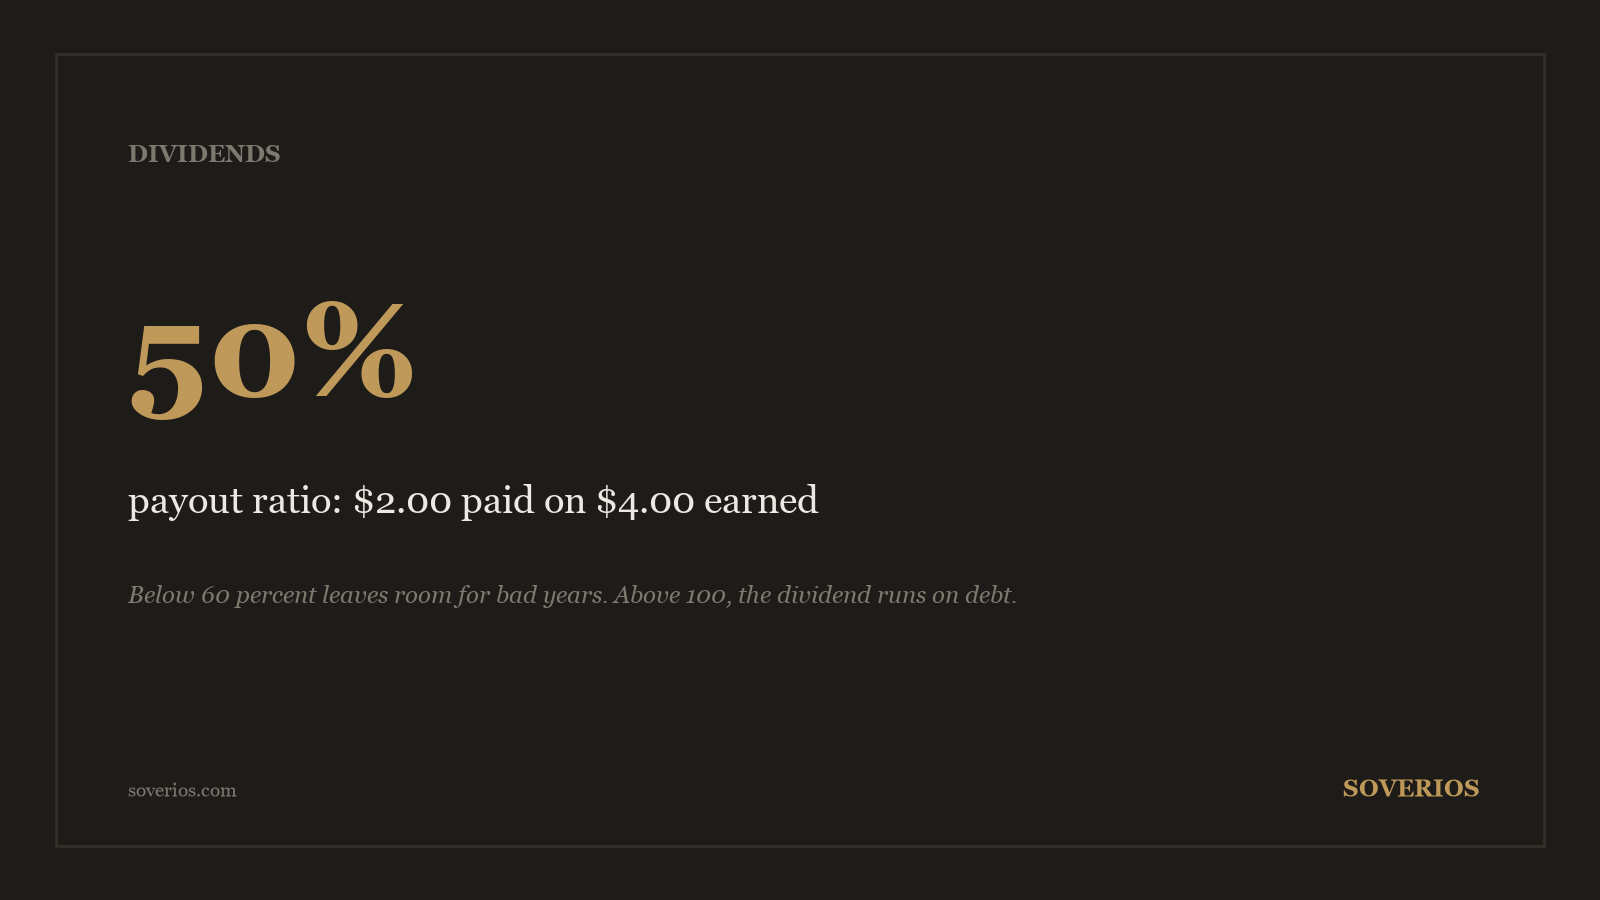
The payout ratio is the share of profit a company hands to shareholders. A hypothetical company earning $4.00 per share and paying a $2.00 dividend has a 50% payout ratio: half the profit goes out, half stays to absorb shocks and fund growth.
This article shows how to read that number, when it lies, and the exact pattern it traces before a cut.
The calculation and the zones
Two versions exist and they should agree. Per share: dividends per share divided by earnings per share. Company-wide: total dividends paid divided by net income.
The thresholds below are rules of thumb for typical US companies, not laws. They assume reasonably stable earnings; a cyclical business deserves stricter cutoffs because its denominator can halve in a downturn.
| Payout ratio | Reading |
|---|---|
| Under 40% | Conservative: large cushion, room to raise |
| 40% to 60% | Balanced: sustainable for most businesses |
| 60% to 80% | Watch: little room for an earnings dip |
| 80% to 100% | Danger: one bad year forces a choice |
| Over 100% | Unsustainable: paying out money not being earned |
Sector context bends these bands. Utilities and other regulated, steady-revenue businesses safely run 65% to 75%, while for a semiconductor company the same number would be reckless.
The pattern before a cut: erosion, not explosion
Dividend cuts almost never come from a board waking up one morning. The usual sequence is a payout ratio that climbs for two or three years while management insists the dividend is safe.
The mechanism is simple: earnings fall and the dividend is defended, so the ratio rises without any announcement. Follow a hypothetical example through three years.
| Year | EPS | Dividend per share | Payout ratio |
|---|---|---|---|
| 1 | $4.00 | $2.20 | 55% |
| 2 | $3.20 | $2.35 | 73% |
| 3 | $2.50 | $2.40 | 96% |
Notice that the dividend rose every single year. To an investor watching only the payment, this company was raising its dividend; to an investor watching the ratio, it was three years into a countdown.
At 96%, the choice narrows to cutting the dividend or borrowing to pay it. This erosion is one of the patterns cataloged in our guide to red flags in financial statements.
The cash flow version: where paper coverage dies
Earnings are an accounting output. Depreciation schedules, one-time gains, and estimates all flow into EPS, which means a dividend can look covered by profits that never arrived as cash.
Dividends, however, are paid in cash. So the sharper test divides dividends by free cash flow: operating cash flow minus capital expenditures, the money actually available after running and maintaining the business.
Take a hypothetical company reporting $500 million of net income and paying $300 million in dividends, a comfortable 60% earnings payout. Its cash flow statement shows $400 million of operating cash flow and $150 million of capital expenditures, leaving $250 million of free cash flow.
| Measure | Amount | Payout ratio |
|---|---|---|
| Net income | $500M | 60% |
| Free cash flow ($400M - $150M) | $250M | 120% |
Same company, same dividend, and the cash version reads 120%: every year, $50 million of the dividend is funded by something other than the business. When the earnings ratio and the cash ratio disagree this much, trust the cash, and if the mechanics are unfamiliar start with what free cash flow actually measures.
Where the numbers hide in the filings
Every input for both ratios sits in the annual report, and none requires a data subscription. Diluted earnings per share appears at the bottom of the income statement, and dividends per share are listed in the same 10-K, usually in the selected financial data or equity notes.
For the cash version, go to the cash flow statement. Operating cash flow closes the first section, capital expenditures appear under investing activities, and the exact dollars paid as dividends are printed under financing activities.
That last line deserves a direct look because it is an actual cash outflow, not a per-share abstraction. Divide it by free cash flow and you have the honest ratio in one operation, with no estimates involved.
Companies with rising share counts can show a flattering per-share ratio while total dividend dollars balloon. Running the company-wide version catches that quietly widening bill.
What the ratio cannot see
The payout ratio compares one year’s dividend to one year’s resources, so it misses claims that outrank shareholders. A company at a calm 50% payout with a wall of debt maturing next year can still be forced to cut, because creditors get paid first.
It also says nothing about the denominator’s stability. An oil producer at 45% near the top of the cycle can be at 150% two years later with the same dividend, which is why cyclical earnings deserve a mental haircut before you compute anything.
Buybacks are the third blind spot. Boards treat repurchases as the flexible lever and the dividend as the promise, so a company can quietly halt billions in buybacks to defend a stretched payout, a move the plain ratio never displays.
None of this makes the ratio less useful. It makes it the opening question, with the follow-ups pointed at debt, cycle position, and total cash returned.
When a high ratio is the market’s verdict, not yours
A stressed payout ratio rarely travels alone. By the time it passes 90%, the share price has usually fallen, which mechanically pushes the dividend yield up and makes the stock look like a bargain to yield screeners.
That combination, collapsing price plus fat yield plus stretched payout, is the classic profile of a value trap for income investors. We dissect the full checklist, debt signals included, in how to spot a dividend about to be cut.
The inverse combination deserves equal attention. A modest ratio around 40% with steadily growing earnings is the raw material for decades of dividend raises, the profile behind the projections in the 20-year math of yield versus growth.
The 30-second check before any dividend purchase
Run this sequence on every candidate, in order, before the yield tempts you. It sits inside the broader framework of our dividend investing guide.
- Compute the earnings payout ratio for each of the last five years, not just the latest. The trend matters more than the level.
- Compute the free cash flow payout ratio for the same years. A gap of more than 20 points between the two versions demands an explanation.
- Compare the current ratio to the company’s own 10-year norm and its sector’s. A utility at 70% is normal; a retailer at 70% is not.
- If the ratio exceeds 80%, or 100% on free cash flow, treat the yield on your screen as provisional. Price in the cut before the board does.
The payout ratio will not tell you which stocks to buy. It tells you, earlier and more reliably than any headline, which dividends are already living on borrowed time, and for an income investor that subtraction is most of the job.
Frequently asked questions
What is a good payout ratio for a dividend stock?
For most US companies, 30% to 60% of earnings signals a dividend the business can sustain and still grow. Sector matters: utilities routinely run 65% to 75% safely, while a cyclical industrial at 75% is already stretched because its earnings can halve in a recession.
Can a payout ratio be over 100%?
Yes, and it means the company paid out more in dividends than it earned. That gap gets funded by cash reserves, asset sales, or borrowing, none of which lasts. A ratio above 100% for more than a year or two is the strongest single predictor of a cut.
Why check the payout ratio against free cash flow instead of earnings?
Earnings include non-cash items and estimates, so they can flatter the picture. Dividends are paid in cash, so comparing them to free cash flow shows whether the business actually generates the money it distributes. When the two ratios disagree, the cash version usually tells the truth.
Does a low payout ratio guarantee dividend safety?
No. A 40% ratio on earnings about to collapse is not safe, and heavy debt maturities can force cuts even when coverage looks fine. The payout ratio is the first screen, not the whole analysis: debt, earnings stability, and cash flow trends complete it.
Educational content only, not investment advice. See our methodology and disclaimer.