The Math of Concentration vs Diversification
Diversification is the one idea in investing that regulators, index providers, and value investors all endorse: the SEC’s investor education materials present it as basic protection. The math behind it is less discussed, and it points somewhere more precise than “own more stocks.”
The short version: spreading a portfolio across stocks removes company-specific risk fast, and the effect is mostly exhausted by 10 to 20 holdings. After that, each additional position buys almost no safety while diluting whatever judgment you have.
That cuts both ways, which is why this article belongs in our index reality check. The same arithmetic that protects the index investor from any single failure also caps what any single success can do.
The two kinds of risk in every stock
A stock’s volatility mixes two ingredients. Company-specific risk comes from things that hit one business: a failed product, a lost customer, a fraud.
Market risk comes from things that hit everything at once: recessions, rate shocks, panics. Diversification can only remove the first kind, because the second is shared by every stock you could add.
How much of each you hold depends on correlation, the degree to which your stocks move together. The lower the correlation between holdings, the more of the company-specific part cancels out.
What the variance math says
A standard textbook model makes the trade-off computable. Assume a hypothetical universe where every stock has 40% annual volatility (standard deviation of returns) and every pair of stocks has a correlation of 0.25.
For an equal-weight portfolio of N such stocks, portfolio variance equals the company-specific part, which shrinks as 1/N, plus the shared part, which never shrinks. The floor works out to 20% volatility in this setup, no matter how many stocks you add.
| Number of stocks | Modeled portfolio volatility |
|---|---|
| 1 | 40.0% |
| 2 | 31.6% |
| 5 | 25.3% |
| 10 | 22.8% |
| 20 | 21.4% |
| 50 | 20.6% |
| 500 | 20.1% |
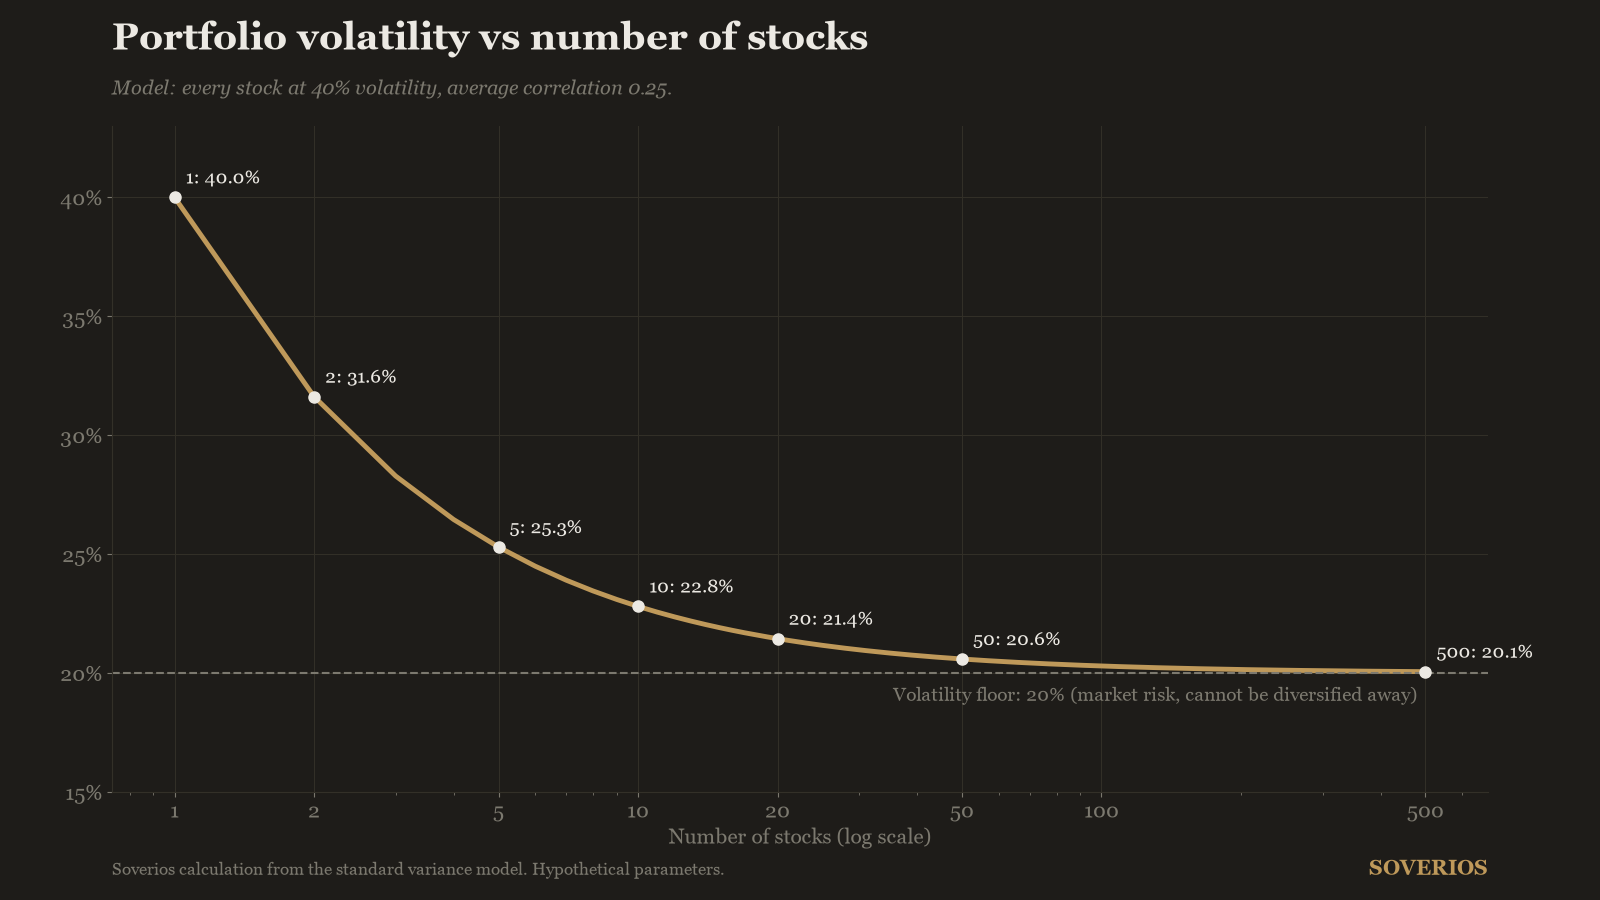
Read the table from the top: the first nine stocks you add take volatility from 40.0% down to 22.8%, closing about 86% of the distance to the 20% floor. The next 490 stocks close most of the remaining 2.8 points, and never quite all of it.
The marginal benefit collapses quickly
The same numbers, viewed as increments, show where diversification stops paying. Each step below adds more holdings than the last and delivers less risk reduction.
| Move | Volatility reduction |
|---|---|
| 1 to 5 stocks | 14.7 points |
| 5 to 10 stocks | 2.5 points |
| 10 to 20 stocks | 1.4 points |
| 20 to 500 stocks | 1.3 points |
This is why “500 stocks is 25 times safer than 20” is false. In the model, 500 holdings are 1.3 percentage points of volatility safer than 20, while being 25 times harder to know anything about.
One honest caveat: the model assumes uniform stocks and equal weights. Real portfolios need holdings from different industries to get correlations anywhere near that low, and ten oil producers diversify almost nothing.
Correlation moves the floor more than stock count does
Keep the portfolio at 20 stocks and vary the average correlation instead, and the effect dwarfs anything extra holdings can do. At a correlation of 0.10, the modeled 20-stock portfolio runs at 15.2% volatility, while at 0.50 the same 20 stocks run at 29.0%.
| Average correlation | 20-stock portfolio volatility | Volatility floor (any N) |
|---|---|---|
| 0.10 | 15.2% | 12.6% |
| 0.25 | 21.4% | 20.0% |
| 0.50 | 29.0% | 28.3% |
The lesson: what your holdings have in common matters more than how many there are. Twenty businesses with genuinely different customers, inputs, and cycles beat two hundred that all depend on the same interest rate.
Correlations also rise in panics, when everything falls together. Diversification is at its weakest exactly when portfolios need it most, which is one reason no stock count substitutes for holding businesses you are willing to own through a crash.
What concentration does to your winners and losers
Volatility is only half the story. The other half is what portfolio width does to the impact of any single outcome, and here the arithmetic is brutally simple: impact equals position size.
Suppose one holding turns out to be a 10x winner over a decade while the others stay flat. In an equal-weight portfolio, that one decision produces wildly different results depending on how many stocks sit beside it.
| Portfolio size | One stock goes 10x | One stock goes to zero |
|---|---|---|
| 10 stocks | +90.0% | -10.0% |
| 50 stocks | +18.0% | -2.0% |
| 500 stocks | +1.8% | -0.2% |
The index investor’s protection and the index investor’s dilution are the same number. A broad fund shields you from any single bankruptcy at the cost of making any single triumph invisible, one of the structural trades detailed in what ETF investors give up.
There is a subtlety on the downside: a winner can grow without limit, but a loser stops at -100% of its position. Concentration therefore skews outcomes toward whichever way your judgment actually leans, which is precisely why it is dangerous without judgment.
Indexes are more concentrated than their stock count suggests
A caveat for anyone who reads 500 holdings as 500 units of safety: cap weighting undoes part of the arithmetic above. When a few giant positions dominate the total, the effective number of independent bets is far smaller than the holding count.
The current numbers on that gap are laid out in the hidden concentration of the S&P 500. The practical point here is that the equal-weight table above is the best case for a given N, and a top-heavy index behaves like a portfolio with fewer stocks than it lists.
How a stock picker should use this math
The math suggests a corridor rather than a single answer: enough holdings that no mistake is fatal, few enough that a great decision still matters. For many disciplined investors that lands between 10 and 25 positions across several industries, each sized so a total loss is painful but survivable.
Width is the easy variable; the hard one is what fills it. Every position should sit inside your circle of competence and pass a written process such as a step-by-step analysis framework before it earns its slot.
Then let the floor set your expectations. Even a perfect 20-stock portfolio carries roughly the market’s volatility, so a deep drawdown will happen to you regardless of skill, and surviving it, as the record examined in beating the market shows, is where most of the game is decided.
Frequently asked questions
How many stocks do you need to be diversified?
In the standard model, most of the removable risk is gone by 10 to 20 holdings, provided they come from different industries. Beyond that, each added stock reduces volatility by a fraction of a percentage point while diluting your best ideas.
Is a concentrated portfolio always riskier than an index fund?
Its outcomes are more dispersed: bigger potential gains and bigger potential losses. Whether that dispersion is acceptable depends on position sizing, on how well you know the businesses, and on your ability to survive a large drawdown without selling.
Why do many funds hold 100 or more stocks?
Partly for liquidity and mandate reasons, and partly because career risk rewards hugging the benchmark. The volatility math shows the risk benefit beyond roughly 20 to 30 names is small, so very long holding lists mostly guarantee index-like results.
Does diversification lower your expected return?
Not by itself: averaging more stocks changes the spread of outcomes, not the expected value. What it does reduce is the impact of your best picks, so skilled selection gets diluted toward the average while unskilled selection gets protected from itself.
Educational content only, not investment advice. See our methodology and disclaimer.
Sources: www.investor.gov